We’d like to remind Forumites to please avoid political debate on the Forum.
This is to keep it a safe and useful space for MoneySaving discussions. Threads that are – or become – political in nature may be removed in line with the Forum’s rules. Thank you for your understanding.
AI pension advice
Comments
-
how badly would the market have to perform for a pot to lose that much by SP?
Like the 1979s, or the 2000s.
but my answer to you is you can't give every person the same advice, for a start life expectancy will be different.
If you know when you're going to die, that makes planning easier.
Do you know this?
If you don't, you'll have to go on typical averages - and they are similar for most people. A typical 57-year-old in fair health can expect to live well into their 80s. However there's hardly any difference in financial outcomes for that 57-year-old if you plan to live to 85, 95 or 105.
I get being cautious, especially if financial advice is your job, but at least try to be objective.
In what way do you think I'm being subjective?
N. Hampshire, he/him. Octopus Intelligent Go elec / Fuse gas / Vodafone BB / iD mobile. Kirk Hill Co-op member.Ofgem cap table, Ofgem cap explainer. Economy 7 cap explainer. Gas vs E7 vs peak elec heating costs, Best kettle!
2.72kWp PV facing SSW installed Jan 2012. 11 x 247w panels, 3.6kw inverter. 37 MWh generated, long-term average 2.6 Os.0 -
The simp has turned up.
That's me telt!
I am not getting at all defensive. And welcome all critque, as I recognize the AI for what it is, unsubstantiated crap
But I am allowed to question replies, free speech and all that.
IIts what we fought Hitler for mate.
0 -
Tou Mean like the 2 worst possible points in recent history?
My point is your basing your scenario as the worst possible outcome there could be.
How about you run the tool you mention above using some of the best years recently? Or even the last ten years average?
0 -
The whole point is i dont want level income for the rest of my life, I'm not going to be wandering around Angkor Wat when I'm 75, but I will be next year.
One thing you might look into is a fixed term annuity. They last for a few years (5 10 etc up to 30 I think) and then expire sometimes with nothing left and sometimes with a substantial pot left which you can put into another fixed term (or lifetime) annuity. Some of these things can generate startlingly high incomes.
0 -
I've looked at them and initially they are tempting, but as soon as you add the rising inflation elements they drop
0 -
Well yes but you can do a level annuity for say 5 years and then go for an inflation linked one later (when your starting income would be at a lower level). Or do a series of 5 year fixed term level annuities at your desired income level (as it drops down).
Of course there would be nothing left for the kids.
0 -
There's a lot of options i know and I'm just playing about, ultimately it will be up to my IFA if if he ever gets back from holiday
0 -
Tou Mean like the 2 worst possible points in recent history?
They were not the worst possible points. There were worse. Ironically, most of the worst scenarios have happened in the last 50 years. Not the earlier 60 years.
In the case of bonds, they had their worst period over November 2021 into 2023. The worst 12-month period for equities was 2008 into 2009.
These are very recent periods.
How about you run the tool you mention above using some of the best years recently? Or even the last ten years average?
The last 10 years' average is high. However, that comes off the back of one of the worst periods. U.S. equities were dire in the first 12 years of this millennium. The 14 years after that, they effectively unwound that bad period and had a tech boom as well and put tech into a bubble. (another one).
If you work on the principle that all markets revert to mean at some point, either we need to enter a golden age for the rest of the industries, or tech has to crash. The last dot-com crash took over 12 years just to recover.
No sensible person does their financial planning on above-median returns. They do it on lower-percentile success rates. Doesn't mean they have to go by the worst-case scenario. They can look at the 25th or 30th percentile. However, that can also depend on how much cash savings they have, how much secure income they have, and how much spending they can afford to drop off in periods of negativity. All of which can be modelled.
I am an Independent Financial Adviser (IFA). The comments I make are just my opinion and are for discussion purposes only. They are not financial advice and you should not treat them as such. If you feel an area discussed may be relevant to you, then please seek advice from an Independent Financial Adviser local to you.1 -
The OP has dug themselves into a bit of a hole by retiring at 56 and taking the 25% TFLS. I hope that is being used for long term income or debt reduction. Aggressive spending in the early years of retirement is dangerous as it's hard to recover from poor sequence of returns…even with cash buffers. The issue isn't average return over retirement is the standard deviation and the timing of deviations from the mean.
And so we beat on, boats against the current, borne back ceaselessly into the past.0 -
how badly would the market have to perform for a pot to lose that much by SP?
tl;df - No idea, but for my circumstances it is where the annualised real return over the first decade is less than 2% per year.
As luck was having it, I was playing with AI and was getting it to model what is the most I can spend each year while having a 10% chance of running out of money by the time I reach age 90. This is similar to @QrizB saying that the OP's plan fails 24% of the time (or whatever), but the other way around. By other way around, I mean I have selected an "acceptable" failure rate and asked my AI to illustrate what is the maximum real post-tax amount I can spend each year. It gave me a number based on the assumptions I used. I then wondered how I would know (as soon as possible) whether it is likely I will run out of money so I can do something about it (e.g. get a job or spend less).
To understand what it said and the graph below, imagine that there were 1,000 different economic scenarios calculated for the next forty-odd years. Some incredibly good, some incredibly poor, some a bit of both and some in between. The AI then looked at the position ten years from now and showed those failures based on the real annual return of the equities over the first decade. By 'real' return, I mean the return after taking out the effect of inflation. It produced this graph (with each bar grouping 200 of the 1,000 scenarios):
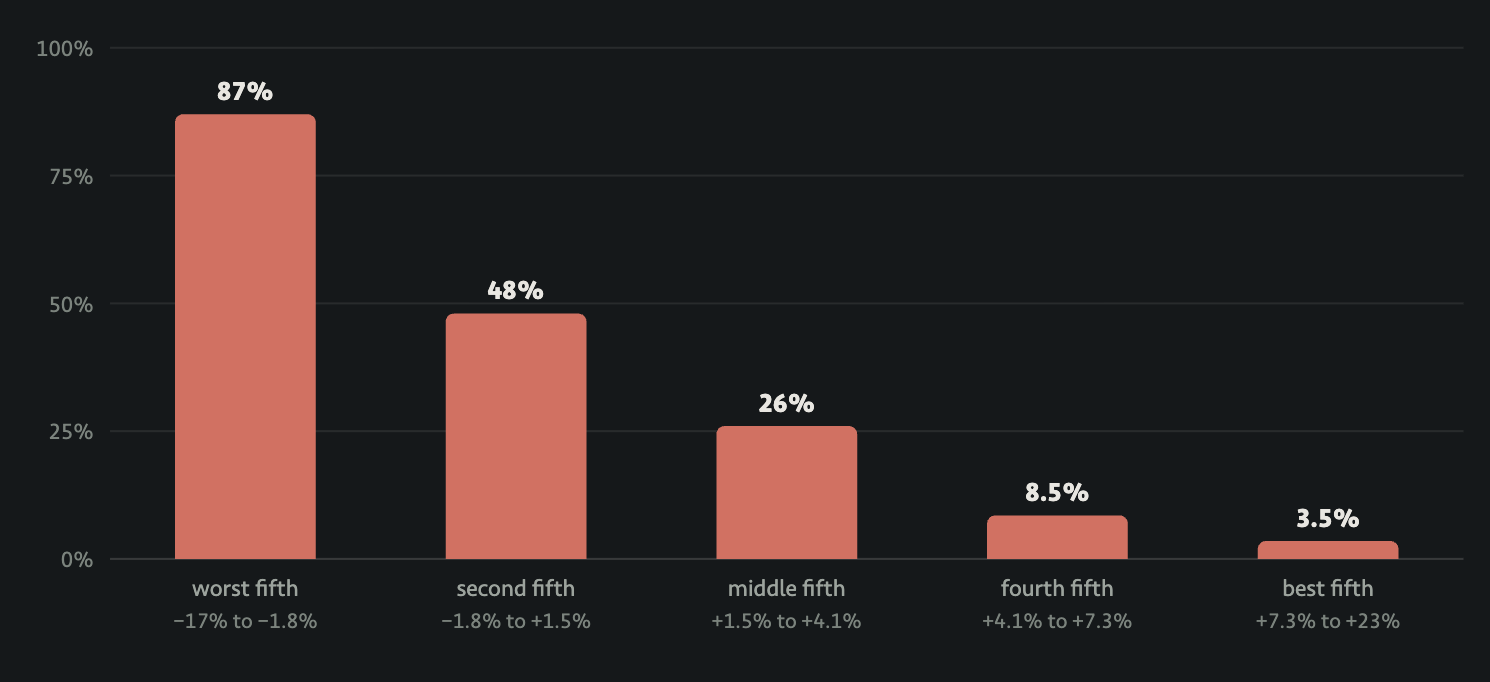
Before someone asks why the percentages in the graph total more than 100%, the graph aims to answer the question: What fraction of the simulations that landed in the bucket (e.g. -17% to -1.8% annual return) failed?
So using my personal circumstances and assumptions (e.g. maximise spending based on a 10% failure rate at 90, my equities, my gilts, my age, my forecast state pension, my assumption of expected real equity/gilt return and volatility, my tax assumptions, and so on, it shows that if the average real return over a decade is -1.8% or worse, 87% of the time I will face financial ruin at the end of my modelling period (age 102, not the age 90 I was aiming at). Where the average real return over the decade is between -1.8% and +1.5%, I will run out of money roughly half the time.
What I take from this is that if we get a situation where (i) there is high inflation, and/or (ii) low growth, for a good while, then I am likely to run out of money. So if I see this sort of thing happening, I can spend less. I'm lucky enough that I can be flexible enough to spend less and reduce that risk.
I should say that there is nothing new about this. The so-called safe withdrawal rate is limited by periods where there is high-inflation and low growth.
For people who prefer intuition, it makes intuitive sense because if I have a period of negative / low real growth over the whole of the first decade, it means that there is no compounding that I can spend for the rest of my retirement. Just to be clear though, I have quite a big cash / gilt buffer in my modelling so it is not selling lots of equities in the years following a massive crash.
So going back to:
how badly would the market have to perform for a pot to lose that much by SP?
In my scenarios, less than 1.5% real growth per annum over a decade is bad news. But it is not the only bad scenario - I could have a great first decade and still run out of money later if the market turns bad for a reasonably long period.
3












Confirm your email address to Create Threads and Reply

Categories
- All Categories
- 355.6K Banking & Borrowing
- 254.8K Reduce Debt & Boost Income
- 456.1K Spending & Discounts
- 248.2K Work, Benefits & Business
- 605.8K Mortgages, Homes & Bills
- 179K Life & Family
- 263.5K Travel & Transport
- 1.5M Hobbies & Leisure
- 16.1K Discuss & Feedback
- 37.7K Read-Only Boards