We’d like to remind Forumites to please avoid political debate on the Forum.
This is to keep it a safe and useful space for MoneySaving discussions. Threads that are – or become – political in nature may be removed in line with the Forum’s rules. Thank you for your understanding.
Emerging Markets Allocation
![[Deleted User]](https://us-noi.v-cdn.net/6031891/uploads/defaultavatar/nFA7H6UNOO0N5.jpg)


Many amateur investors, like myself, frequently become confused by how much to allocate to different regions, there are often as many questions as there are answers. We recently debated at length, the merits of reduced US allocations, now the subject of Emerging Markets (EM) allocation arises. Whilst I have arrived at my answer on this, many others haven't.
Linked below is a six-year-old paper from one of the Wall Street investment banks, in it they discuss EM allocation options. As you can see from the following chart, the range is huge, 6% to 39%, based on how you calculate it, and that’s without even considering your own risk appetite and preferences.
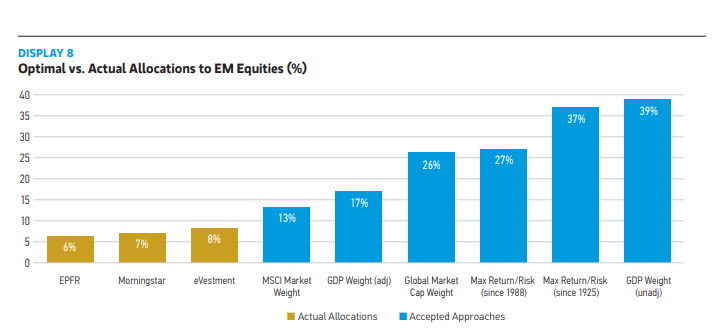
The report concludes by recommending that investors should allocate between 13% and 39%, interestingly, not the 7% implied by Morningstar. For my part I hold 17% in EM, a level that one forum member recently described as, a substantial tilt. But really, it’s not, my preference goes hand in hand with my desire to only hold 33% of US assets, which means that excess equities allocation has to go somewhere. By contrast, the FTSE All World holds 64% and 10% respectively.
The concept of more equally weighted geographic allocations has long appealed to me, although those members who hold global trackers that contain market weighted allocations, may well be horrified at the idea! I think the message here is that there is no definitive right or wrong, global trackers are weighted as they are mostly based on investor population sizes and buying power, not on any insurmountable factors that relate to risk, markets or shrewd investing.
https://www.morganstanley.com/im/publication/insights/articles/article_howmuchtoown_us.pdf
Comments
-
There are different ways to measure your actual allocation too. Mine is about 16% of the equities part of my portfolio, but only about 8% of my overall portfolio.
Immediately after the 2008 credit crunch, I can remember having close to 30% of a 100% equities portfolio in the old First State GEM Leaders fund before dialling back, in part because it doubled in value over two years. That seemed like quite a tilt. I would not do something like that today.
1 -
You will find the market's answer here:
Emerging Markets are currently 10.1% of the FTSE All World Index.
0 -
The initial post already says that, the question is,are you sure the markets answer is the right one, the paper argues otherwise.
0 -
The article seems to measure on a portfolio basis rather than the share of equities. Like you, my EM holdings represent 21% of my equities but only 8% overall. Correction, 17% of my equities.
0 -
The paper is 5 years old, but seems largely to be trying to reverse fit what proportion of EM would have been optimal from a performance perspective in the past. They do point out that the MSCI index weighting is the only one that corrects for free-market float, liquidity etc. so it would seem to be the one to go for if you're going for the market consensus approach (which doesn't therefore need rebalancing etc.). - it's the difference between looking at the future performance of the actual shares being traded, vs the companies (non-free float market cap) or countries (GDP). The lack of governance and transparency associated with EM doubly makes that important.
Contrary to the paper's expectations, said weighting hasn't increased from the 13% at the time of the paper, it's now about 12% by MSCI's definition, 10 by FTSE (since they differ in classification of Korea for e.g.)
1 -
To clarify a slightly confusing exchange earlier, this is what my equities holdings look like, expressed both ways.
% of
% of
Portfolio
Equities
US
16%
32%
UK
8%
16%
EU
7%
14%
EM
5%
11%
Japan
5%
11%
Asia Dev
5%
10%
China
3%
6%
49%
100%
1 -
Is China also represented within your EM holdings?
0 -
Yes, it's 5% + 3%, (or 11% +6%) but I break them out separately for tracking purposes,
1 -
It’s hard to define what’s true EM these days…I have worked out a rough estimate that my non US/UK/EU/Japan holdings are about 28% which is predominantly Asia and China with a bit of Canada/Brazil/Mexico/South Africa. Adding to my tech funds back in March when they dropped 10% has pushed me a bit overweight and beyond my target allocation of 25% so I’ll probably rebalance back later this year
1 -
Investing and it's study can be fun, but it runs the risk of it's practitioners taking it all too seriously. There might be some properties that emerge from financial things when taken over large enough and long enough samples, but how they relate to our individual finances is very difficult to interpret. I both admire and pity the OP for their question because it's potentially interesting, but ultimately futile.
And so we beat on, boats against the current, borne back ceaselessly into the past.1


Confirm your email address to Create Threads and Reply

Categories
- All Categories
- 354.9K Banking & Borrowing
- 254.6K Reduce Debt & Boost Income
- 455.6K Spending & Discounts
- 247.7K Work, Benefits & Business
- 604.7K Mortgages, Homes & Bills
- 178.7K Life & Family
- 262.3K Travel & Transport
- 1.5M Hobbies & Leisure
- 16.1K Discuss & Feedback
- 37.7K Read-Only Boards