We’d like to remind Forumites to please avoid political debate on the Forum.
This is to keep it a safe and useful space for MoneySaving discussions. Threads that are – or become – political in nature may be removed in line with the Forum’s rules. Thank you for your understanding.
Octopus forecast electricity costs could increase 15% plus by 2030.




three different takes on projected input of current policy - one biased more by Iran perhaps.
"Another forecast, by energy supplier Octopus, suggests electricity bills could increase by at least 15% by 2030, with grid investments and other costs adding about £260-£300."
And thats from a renewables generator, those collectively requiring / driving / demanding those grid connections and no doubt also potentially sharing in NESOs forecast now over £3bn 2030/31 in grid thermal constraint payments.
or perhaps another push for regional by Octopus so as not building 400 mile plus hvdc links (at c£4bn a go for latest approved iirc) to Scotland south to markets for their power.
Comments
-
British Gas said similar two months ago.
2 -
Worth noting that, in the same article, Ofgem are predicting a £30-a-year rise while an independent analyst is predicting £80-a-year. So it's a rather open question.
Also, the quoted part isn't internally consistent. The current Ofgem cap works out as £947/yr for a 2700kWh/yr household, so a 15% increase would be £142. If costs are actually going up £260-300 then that's an increase of 27-32%.
And here's another quote from the article:
Energy analysts tend to blame years of underinvestment.
A recent study, external found energy network operators had underinvested by £490m annually.
Two energy analysts pointed to a 2009 decision made by Ofgem to enable new wind farms to connect to the network before the grid had been expanded.
"This created a precedent for avoiding investment," says Adam Bell, director of policy at Stonehaven, a consultancy. "This is the explanation the government prefers."
So we're incurring costs now that we should really have installed over the past 17 years. Paying the costs for all those cheap bills in the 2010s.
N. Hampshire, he/him. Octopus Intelligent Go elec / Fuse gas / Vodafone BB / iD mobile. Kirk Hill Co-op member.Economy 7 cap explainer. Gas vs E7 vs peak elec heating costs, Ecoflow Stream, Best kettle :-)
2.72kWp PV facing SSW installed Jan 2012. 11 x 247w panels, 3.6kw inverter. 37 MWh generated, long-term average 2.6 Os.0 -
A quick glance suggests this isn't a particularly good report/article to base future costs on.
If it were on printed media it would be useful for fish and chips.
1 -
So you agree Octopus take is the highest of the 3 figures.
it didnt say going up by £260-300 - it said those are the grid and other costs built into the price.
Some of which might be necessary due to past underinvestment - without renewables and net zero - after all about £40 of riio3 revisions by 2031 were gas network related at one stage (mid 2025 mid industry / Ofgem framework proposal). The Apr £66ex vat just the initial bite at the cherry.
But £10s of billions of new grid and hvdc links, and upto now low £3.x bns pa in grid thermal and in total £8bn+ pa in operating / balancing costs wouldn't be.
And whilst underinvestment might have on average been lowering our bills, renewables on average werent lowering our bills - old pre CfD contracts get gas rates (so much so put under EGL in 2023) and apart from 3 quarters CfD have been neutral in one or additive to cap when warranted a mention by Ofgem in cap letters since 2019.
And the notional saving for all that investment wind power in previous time of need - on regular cap rate bills to date afaik from Ofgem cap letters - lets take the example at peak of Ukraine crisis. When holesale wind CfDs saved iirc just c£40-45 in Q1 quarter when non epg cap hit over £4000. And CfD back positive cost when energy returned below well above current Q3 forecasts due to Iran.
Plus if any (given late implementation) any EGL levy earned on non CfD renewables earning more than £75/MWh. A price point obviously considered excessive in 2023, but yet latest ar7 offshore wind licensed at upto £91.20 on extended 20 yr term (which should surely mean lower cost than old 15 yr return pricing) at 2024 indexing.
0 -
Does this idea of "regional pricing" extend to payments for generation? It seems to me that windfarms in Scotland or Shetland produce energy that's actually worth less per kWh than production in the South or Midlands.
0 -
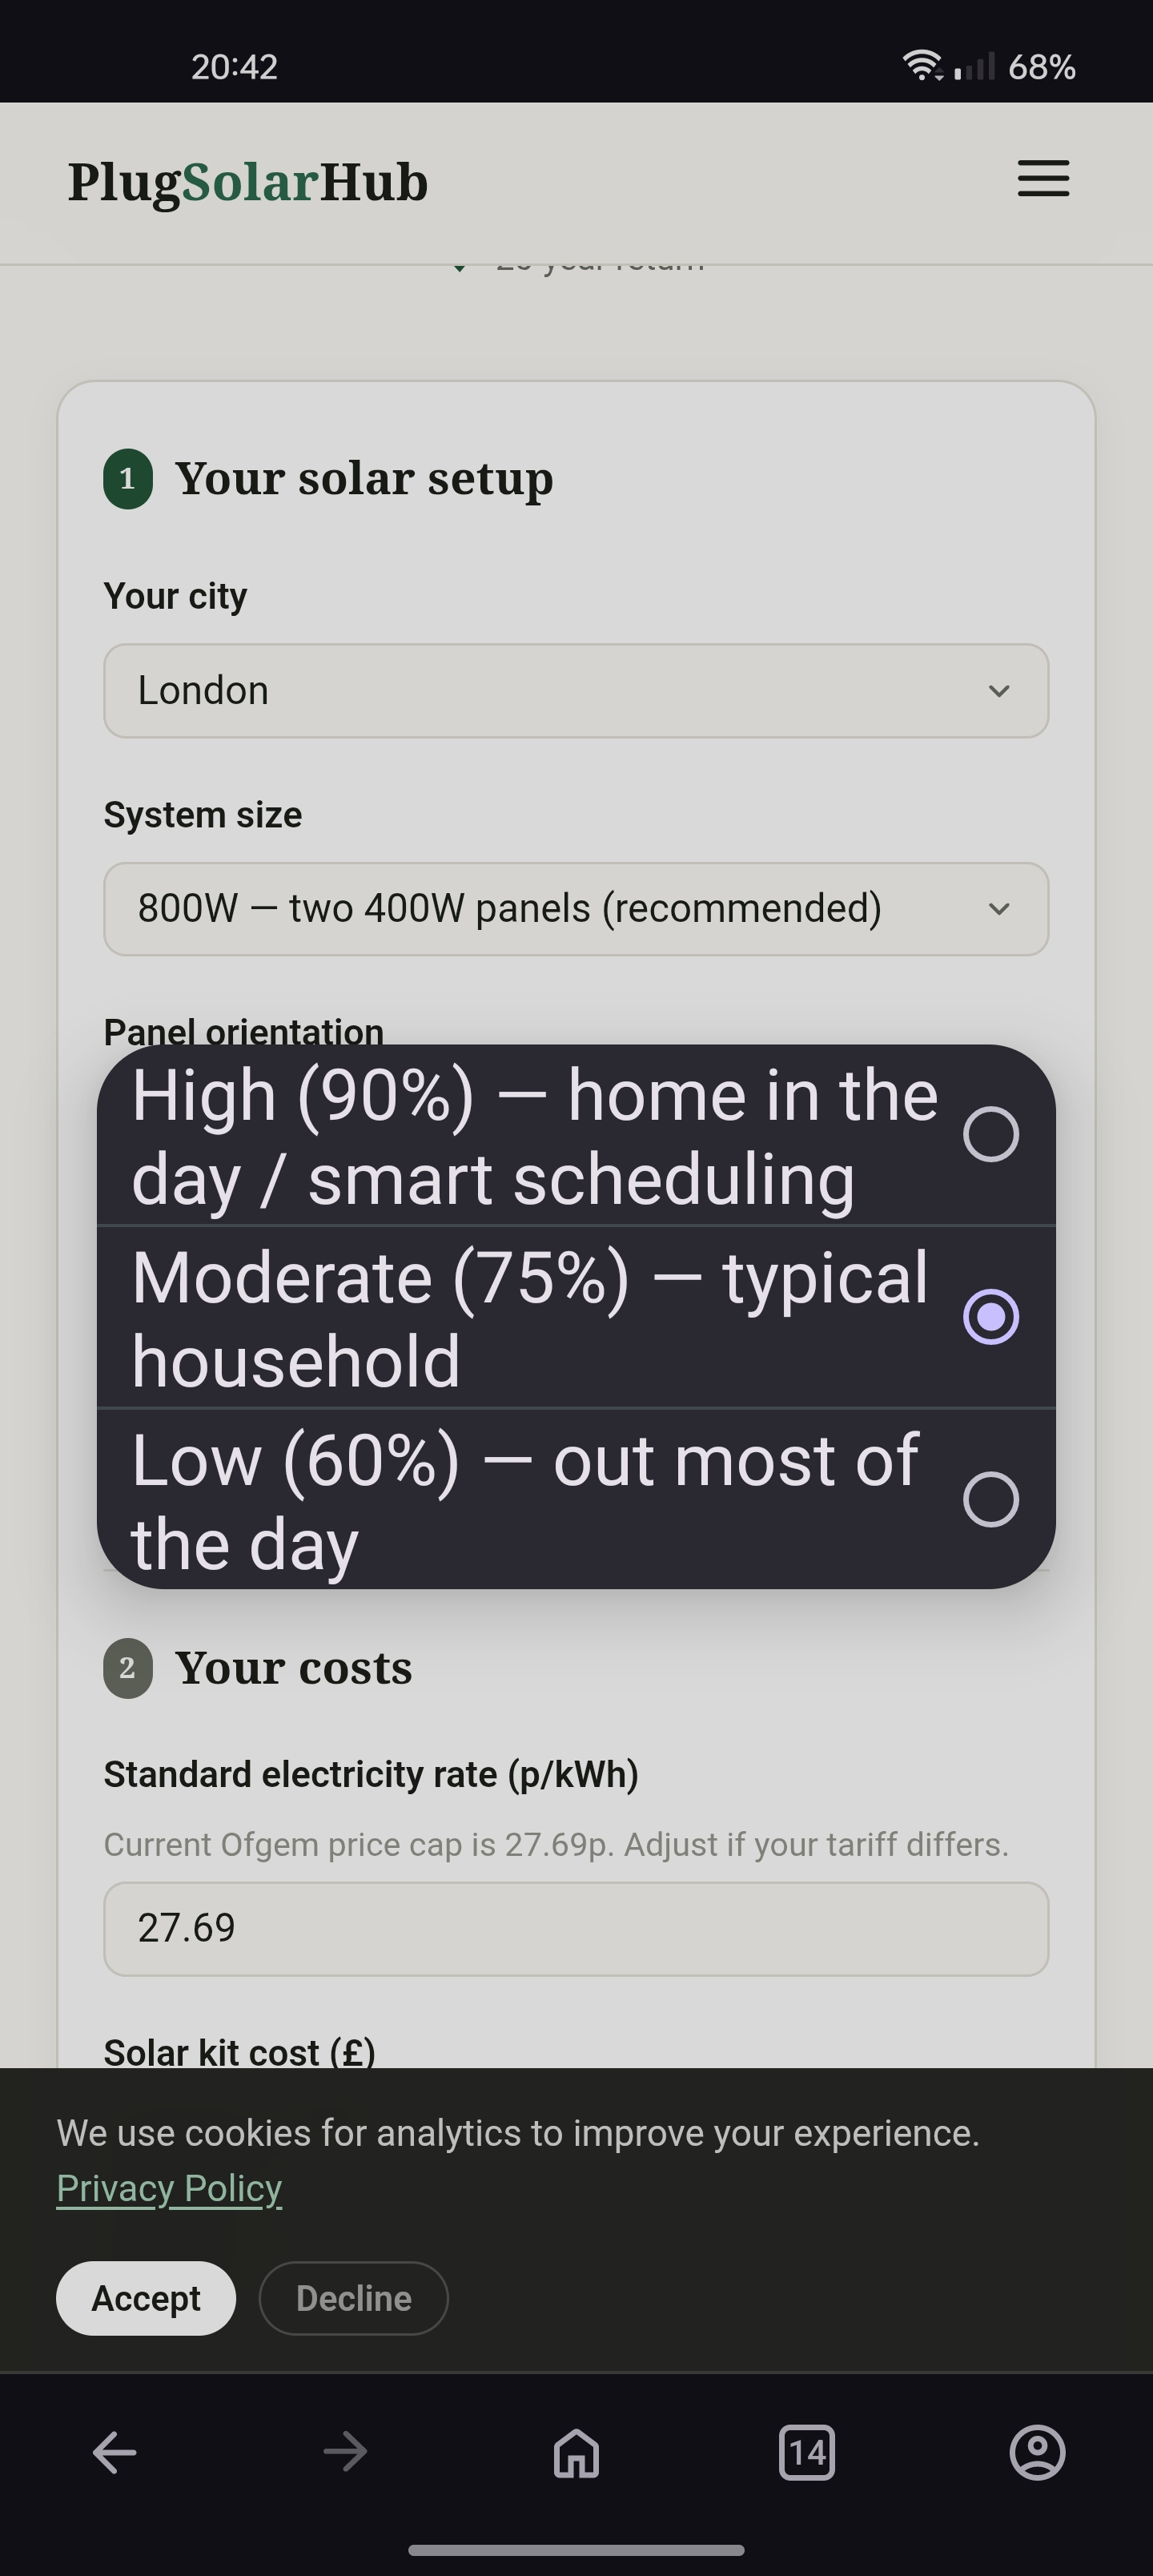
Not to seem harsh but no way if someone is out most of the day they will use 60% of the solar generated.
This is where people will be disappointed it just won't be the payback period expected if these calculators lie to potential customers.
 1
1 -
As to value of that Scottish Power
The idea is I suspect that once the £10s of billions (upto £14bn+ pa in current 5 year plans iirc by just the 3 TNO's - SSEN, SPEN and NG south of the border) are spent on new grid and new HVDC links - Scottish generated power wont actually be worth any less - as accessible to the whole nation (and possibly I suspect the generators hope for export to Europe - despite us funding those network connections south).
Grid level transmission losses, HVDC losses are a small - maybe as little as 20% of total distribution losses (that amplify as step down in voltage from grid, sub 2% - vs 5-8%+ at local distribution (like 33kV/11kV/6.6kV) and then street level 240V voltage losses)
I dont know if its happened before - but not all new UK offshore wind got the same £91.20 in AR7 - the one Scottish site of c1.4GW at Berwick - Berwick B - got a little bit less - £89.49. Less than 2% less.
Anyone know the real reason for that small difference above (Technical, devolution, bid by project etc) ?
Its also interesting that the Berwick farm if all phases go ahead - seems to be planned to land power at 2 potential sites - one not too far - from Dunabr - near Torness nuclear site - and iirc thats also close to one end of EGL1 being built - and the other in Tyneside near Blythe - north of Newcastle.
Current State
But most of Scotland's current installed wind capacity is currently on shore - over 10GW actively "generating on grid" vs maybe 4GW offshore as of Q2 2025 - only a bit less see govt link below - when UK wide total wind hit 30GW threshold in 2024 - for a mid 2024 figure of 9.5GW.
Scottish plans
Seen figures as high as another 15 GW to add offshore to the as of late 2022 just c2GW connected (which doesnt include newer onstream fields like iirc current largest c1.08 GW at Seagreen connected c2024 - that was part of the then c15GW) by 2030.
Scotland had as above just over 10GW of on shore wind farms connected Q2 2025 - with 12 GW including those already in construction expected soon and about another 6GW (so 18GW total) licensed / planned. With 20GW - possibly as high as 25GW by 2030 - at one stage not unrealistic according to Holyrood / Scottish Crown office / industry forecasting.
Getting it all connected to larger markets
EGL1 and 2 alone already approved at a cost of c£6bn - to add to existing WGL (Ayrshire to N Wales in use for 6+ years at upto full capacity) for North South Transmission.
The extension of Shetland Viking - was conditional on the building of the Shetland HVDC link - both are now in use - so that power is accessible - at least at one point on mainland - if not further south.
In Dec 2025 EGLs 3 and 4 and one other - were put on accelerated planning by Ofgem
And like getting the supply to English population centres - there are still going to be real bottlenecks in the grid covering the 100s of miles (maybe 300+) - from some remote sites - to the major population in parts of Scotland's central belt - Glasgow etc. Arguably Dunbar location could suit Edinburgh more (there must be decent connections from Torness already - its c1.2GW net output in past - and life extended again recently by EDF by another 2 years to 2030 iirc). So might be able to reuse (or "recable" for added capacity) if timelines suit.
But a big difference as above to distributed supply / demand - in the North - is that Scotland has also allowed more even before - and continued with on shore wind farm development during - the 9 years of the almost but not quite freeze - due potentially to the local objections clauses - in England's planning regs from 2015).
That made me wonder how much capacity actually added on shore in England in those 9 years - doesn't quite cover the full period - but the impact potentially visible here - on p8 - which nearly flat lines c2017 once I guess previously approved developments ended
https://researchbriefings.files.parliament.uk/documents/SN04370/SN04370.pdf
Judging by the chart on p8 in the above England still had some small growth - so wasn't zero - but certainly well below Scotland's maybe 2+GW extra. (I'd have to download the linked excel to get figures given scale and nested chart).
At the time of that report - late 23/24 - Scotland had 9.5GW on shore, England just 3.1GW - less than a third for 10x the population. And again the locations map for onshore - on p10 - shows a stark difference.
0 -
My background load varies between 15-25W (router, smoke and burglar alarms etc) and 90W if FF compressor on - if dark add 7W for an LED bulb.
And even if in with PC or TV only on - most of the time - sub 250W.
I'd have to factor that sort of low use into payback.
I'd save more if used for heating - but solar pretty grim output wise in Dec/Jan when my heating bills are high - and my main heating on an isolated restricted feed from meter to normal circuits anyway - so plug in may not influence it at all.
I suppose I could use a little fan heater or a plug in OFR on lowest settings to use more of the potential output and turn those down a bit - but to save costs there kept pretty close to min in any case most weeks of the winter.
I'd far rather the govt stopped increasing electricity prices in the name of net zero - "further and faster" than most other nations.
And put far more of the net zero transition costs onto gas than existing already hard pushed electricity users.
After all it is their boiler emissions that were adding 20% plus to UK's emissions. Probably more as more go ASHP and ICE to EV. Like say if the 75% RO costs do return to bills in 2029 (remember the budget move is temporary - only funded for 3 years) - they go on gas and electric - so both fuels pay say 50%.
0 -
The idea is I suspect that once the £10s of billions (upto £14bn+ pa in current 5 year plans iirc by just the 3 TNO's - SSEN, SPEN and NG south of the border) are spent on new grid and new HVDC links - Scottish generated power wont actually be worth any less
That's the point, those wind farms dictate the need for those extra billions, yet don't have to pick up the tab.
0 -
So I did some rough calculations after a bit of googling about what a panel might output and most suggest a whole year a 800w plug in solar mounted facing south will produce roughly 800kwh. 3 times more generation between April and September.
Rough calculations a household or flat where people go out to work then might save £90-100 a year as surely most buying these will take and interest and try and maximize use of some of the generation.
The cheapest system I have priced up using panels from city plumbing £56 for 410w panels delivered and a trusted micro inverter with some brackets is around £250(lower depending on brackets required). So even those that don't optimize any use the payback is 2.5 years
Anyway swinging this back to Agile this type of system is good for Agile customers. All that extra generation will surely funnel into the network for free and bring down prices when the sun is shining (or is that too simplistic a view)
On your last couple of paragraphs as an alliance electric household we fully agree and we are in the hands of mad Ed for that.
0








Confirm your email address to Create Threads and Reply

Categories
- All Categories
- 355.7K Banking & Borrowing
- 254.9K Reduce Debt & Boost Income
- 456.1K Spending & Discounts
- 248.3K Work, Benefits & Business
- 605.8K Mortgages, Homes & Bills
- 179K Life & Family
- 263.6K Travel & Transport
- 1.5M Hobbies & Leisure
- 16.2K Discuss & Feedback
- 37.7K Read-Only Boards