We’d like to remind Forumites to please avoid political debate on the Forum.
This is to keep it a safe and useful space for MoneySaving discussions. Threads that are – or become – political in nature may be removed in line with the Forum’s rules. Thank you for your understanding.
US Markets Risk
Comments
-
It's hard to disentangle the underlying factors contributing to the performance results. Perhaps it does. If so, you'd expect the effects to be greatest in periods when markets have been most volatile. There seems to be some emerging correlation of this, with equal weight performing less well over the volatile 2020s than the smoother 2010s (where low interest rates and loose monetary policy created a rising tide that lifted all ships). I'd be interested in how such a fund would have performed over the 2000s.
But we also have to consider that the 2020s was when a disproportionate amount of the positive returns came from the largest companies in the index. Looking at the annual report of such a fund, the transaction costs are still very low as a proportion of AUM, but I suppose on top of that there will be spread and other hidden costs. Tracking error seems to be higher, and this has been a benefit to the performance of these funds during a time of underperformance, indicating they are probably not rebalancing as frequently as the underlying equal weight index.
But for me, it was principally a point around investment philosophy. I'm a believer in buying and holding for the long term, and I try to avoid making changes unless my personal circumstances and objectives change. So funds that continually tinker with weightings according to short term market ups and downs are off-putting. If I could not use a collective investment fund and had to buy shares directly, I would not be seeking to replicate this sort of behaviour, I would bias at the outset then hold, which is closer in alignment to what other strategies do in practice.
1 -
And Amazon is classed as consumer cyclical despite being largely a tech company these days.
1 -
I think it's important to look at the US allocation issue through the eyes of a novice investor and not to underate the simlicity of the solution I chose to adopt. Whilst there may be more elegant and efficient ways to solve the Tech concentration issue, the usefullness of any solution is going to be proprtional to the ease with which it can be adopted. There are, as we know, many novice and some semi experienced investors who have yet to fully understand the concentration issue. Making those people aware is the first step, suggesting a simple easy to adopt solution is the second. The more savvy and aware investors can make their own decisions, because they are likely to have the knowledge, experience and confidence, but the newbies do concern me.
1 -
Sure, but care is needed so novice investors don't react too emotionally when you cry wolf about tech/comms concentration. It is easy to point it out; more difficult for the novice to decide whether to react to it, before deciding (simply or otherwise) how to react.
1 -
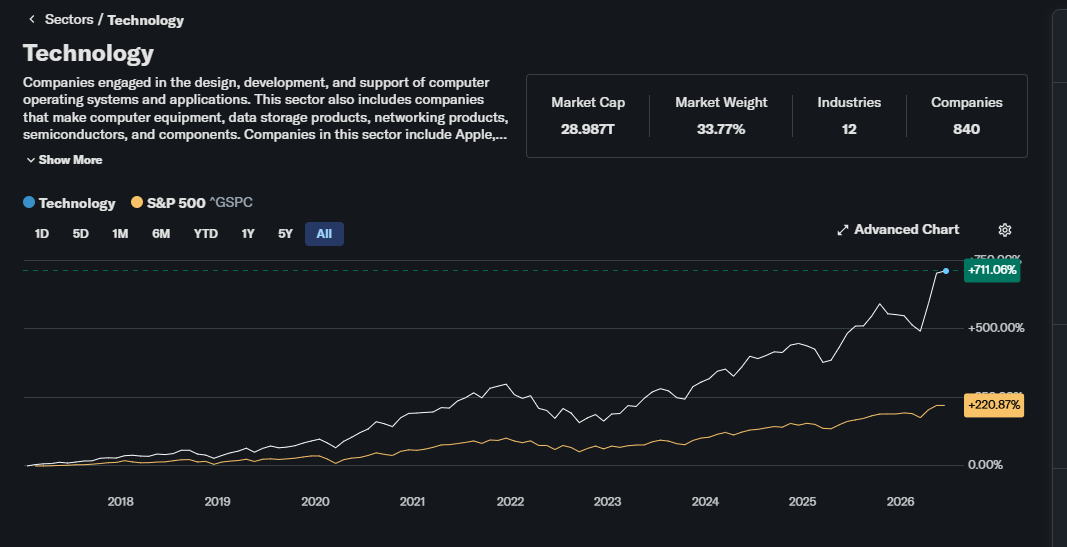
Yes agreed. But I don't know how to pitch that argument so that it's truly objective. You could start by saying there are eleven business sectors, which implies an average of 9% per sector. Currently, the US index is showing that the Tech sector is about 36%, which when Tech companies in the Comms sector and included, jumps to almost 50%. This may be OK during a time of rapid and large scale technological advancement but alternatively, it may be a bubble. What this means for investors is that for every Pound invested in the S&P 500, 50p is betting on technological change products and services and nothing else. There are steps you can take to mitigate this anomally and they are discussed in this thread. Alternatively, you may view all of this as business as usual, in which case you need do nothing, other than be aware.
Is that sufficently objective or do you see that as overly hyped?
0 -
Suggesting that tech/comms is 50% when it should - two of elevens sectors - be 18%, suggests a whole pack of wolves are coming for you. Maybe you could start by splitting the last 50 years into five year periods, looking at the average index % of each sector within those periods, calculating their performance, and assessing how performance was related to sector cap. That should keep you out of trouble for a week or two!
0 -
I've put up a straw man in case anyone else wants to play with it, I'm safe inside my wolf proof cage. .
0 -
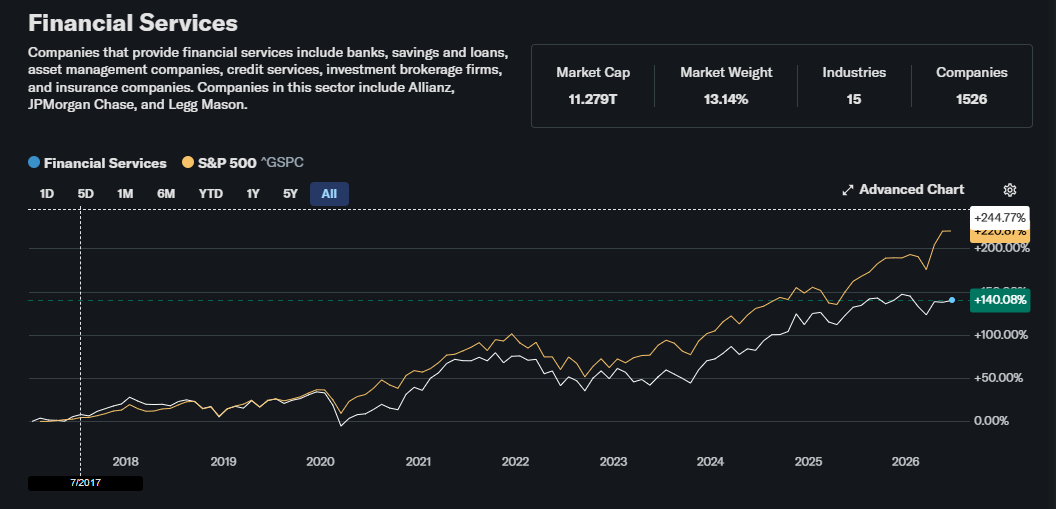
It was easy enough to chart the last eight years, I shalln't look beyond that:
 0
0 -
One of the things with tech is that it's embedded in every business sector. Other sectors don't have that kind of influence. Companies / services like Salesforce, Slack, AWS, Google, are deeply embedded in companies across the spectrum. It's not something that can said for, e.g., mining, retail, agricultural or manufacturing companies. Yes, they have reach, but they aren't fundamental to other sectors in the way that tech is
1 -
One could suggest the same about Financial Services and the degree to which they are imbedded. Yet FS is only 13%!
 0
0


Confirm your email address to Create Threads and Reply

Categories
- All Categories
- 354.8K Banking & Borrowing
- 254.5K Reduce Debt & Boost Income
- 455.6K Spending & Discounts
- 247.6K Work, Benefits & Business
- 604.5K Mortgages, Homes & Bills
- 178.6K Life & Family
- 262.1K Travel & Transport
- 1.5M Hobbies & Leisure
- 16.1K Discuss & Feedback
- 37.7K Read-Only Boards