We’d like to remind Forumites to please avoid political debate on the Forum.
This is to keep it a safe and useful space for MoneySaving discussions. Threads that are – or become – political in nature may be removed in line with the Forum’s rules. Thank you for your understanding.
Why buy annuity
Comments
-
In real terms how much does inflation matter to a large percentage of the older generation?
In many instances....no mortgage, no car, no fancy holidays.
The cost of heating their home and cost of smoked salmon in M&S is probably the key driver for many.
Not forgetting that if inflation is high, so are saving rates. My parents and partners parents are both working class retirees with more money than they have ever had.
Recognising of course that for those renting and potentially living on the limit that it really matters.
If you are going to invest in high risk stuff, then you are always more likely to come a cropper. Hence why the older folk often stick to a good old bank account and cash in envelopes! I know my dad still draws £250 cash (state pension) every Monday and hands my mum 'housekeeping' and stuffs the rest in a bill envelope! It works for them. 0
 -
For those interested…
Inflation linked annuities are relatively straightforward to compare against historical withdrawal rates. For example, the UK SWR for a 30 year retirement is 3.0% to 3.5% (depending on data set and exact holdings), so if the inflation linked payout rate (at say 67 – corresponding to a relatively extreme lifespan of 30 years to 97) is greater than this, then historically the annuity would have provided more income than the worst case. Of course, in good retirements, drawdown would have provided much more (although, as always, the problem for the retiree is that at the start of retirement it is unknown whether conditions are to be good or not
Once you have the data sets, it is relatively easy to put together drawdown and level annuities.
As a specific example, here is an historical case starting in 1937 with a target constant inflation adjusted total income of 3.5% for four scenarios (the income is plotted in real terms). The first is where no annuity was purchased (50% UK equities, 50% UK gilts), and the next three all involve using 40% of the initial portfolio to purchase a level annuity (assuming an age of 67) with payout rates of 4.8%, 5.8%, and 6.8% (more on these values below). After purchase, the remaining portfolio is held at 80% equities and 20% gilts to roughly keep the overall allocation close to 50/50.
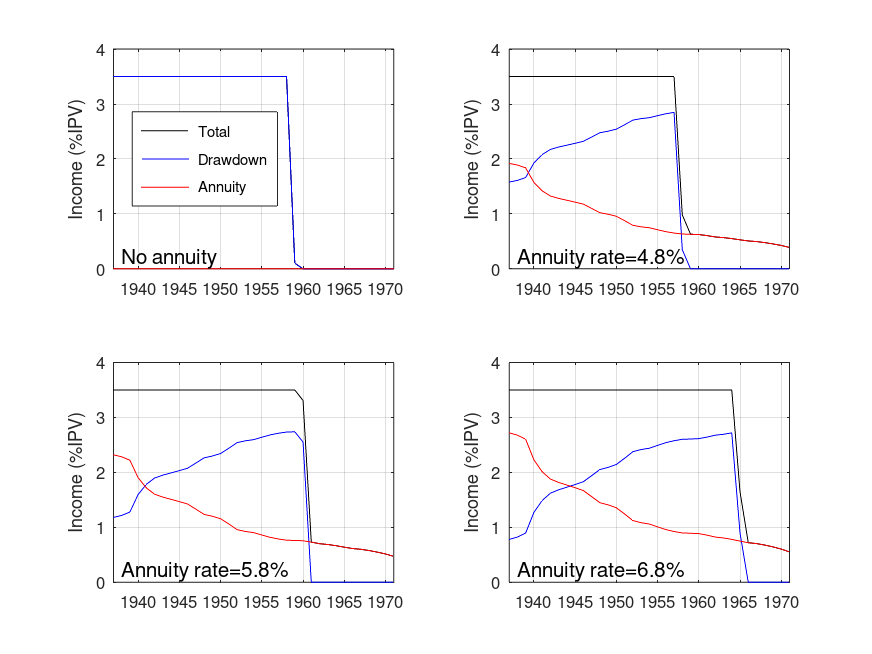
With no annuity, the portfolio runs out of money just before 1960 and subsequently, the income is zero. With the lowest rate of 4.8%, the portfolio is exhausted just before 1960, but there is a small (about 0.6%) and declining residual income from the annuity. For an annuity rate of 6.8%, the retiree would have got an additional 5 years of thew full target income and the residual income after portfolio exhaustion would have been a bit higher.
This post is already rather long, so I'll show another couple of examples later.
Notes:
All asset returns and inflation data from macrohistory.net.
While historical annuity rates have been published (e.g., see https://ideas.repec.org/p/ecj/ac2004/71.html – select the download tab), for the same gilt yields, these were much higher than now because life expectancies have increased. In order to calculate a ‘semi-historical’ single life, level rate of 6.8% I’ve taken the yield (about 3.3% in 1937) and the modern life expectancy at 67 of 19.5 years (the average of 18 years and 21 years for male and female, respectively) and then used the pmt function with the number of periods set to the life expectancy (this is an approximation that will get within about 10% of the ‘true’ value, i.e., 6.8 plus/minus 0.7). The lowest value (4.8%) might represent a joint life payout rate.
For those interested, there are a few papers on this subject, as usual, mostly written from a US perspective
Ameriks, J., Veres, R., and Warshawsky M. J.(2001). “Making Retirement Income Last a Lifetime.” Journal of Financial Planning 14, 60-76.
Kitces, M. E and Pfau, W. D. (2013). “The True Impact Of Immediate Annuities On Retirement Sustainability.” Available at SSRN https://ssrn.com/abstract=2296867 or http://dx.doi.org/10.2139/ssrn.2296867
Milevsky M. A. and Huang H. (2011). “Spending Retirement on Planet Vulcan: The Impact of Longevity Risk Aversion on Optimal Withdrawal Rates.” Financial Analysts Journal, 67, 45-58, DOI: https://doi.org/10.2469/faj.v67.n2.2
Milevsky, M. A. and Young, V. R. (2007). “Annuitization and asset allocation.” Journal of Economic Dynamics and Control, 31, 3138–3177, DOI: https://doi.org/10.1016/j.jedc.2006.11.003
Pfau, W. D. (2019). “Safety-first retirement planning: An integrated approach for a worry-free retirement.” Retirement Researcher Media, USA.
McQuarrie, https://papers.ssrn.com/sol3/papers.cfm?abstract_id=4160167
I note that the Milevsky and Young paper is somewhat mathematical, while Pfau's book is more straightforward (but, consequently limited).
4 -
In the recent bout of inflation, CPI exceeded 10% while the interest rates on easy access savings accounts peaked at around 6% or so (i.e., without withdrawals, a 4% real loss in purchasing power). Those of us who chase interest rates online will do better than those who've left their cash in a mainstream bank account where rates have been, and still are, less than 2%. I note that the worst real annualised return on cash (using 3-month bills as a proxy) in the UK over a 20 year period was -4% (for periods starting pre-WWII), although negative real returns on cash last occurred for 20-year periods starting in early 1960s. In other words, cash is, in real terms, potentially very high risk.Cobbler_tone said:In real terms how much does inflation matter to a large percentage of the older generation?
In many instances....no mortgage, no car, no fancy holidays.
The cost of heating their home and cost of smoked salmon in M&S is probably the key driver for many.
Not forgetting that if inflation is high, so are saving rates. My parents and partners parents are both working class retirees with more money than they have ever had.
Recognising of course that for those renting and potentially living on the limit that it really matters.
If you are going to invest in high risk stuff, then you are always more likely to come a cropper. Hence why the older folk often stick to a good old bank account and cash in envelopes! I know my dad still draws £250 cash (state pension) every Monday and hands my mum 'housekeeping' and stuffs the rest in a bill envelope! It works for them.
Of course, the effect of inflation on cash in the short-term (i.e., £250 to last a week or a few months) is usually negligible.
0 -
But nobody would invest their pension 100% in the UK.OldScientist said:As a specific example, here is an historical case starting in 1937 with a target constant inflation adjusted total income of 3.5% for four scenarios (the income is plotted in real terms). The first is where no annuity was purchased (50% UK equities, 50% UK gilts), and the next three all involve using 40% of the initial portfolio to purchase a level annuity (assuming an age of 67) with payout rates of 4.8%, 5.8%, and 6.8% (more on these values below). After purchase, the remaining portfolio is held at 80% equities and 20% gilts to roughly keep the overall allocation close to 50/50.
0 -
Run a simulation from 2000 and the reverse is true.......the IL annuity would have proved costly if used alongside drawdown.zagfles said:
Indeed - that would be an interesting model. But the problem is drawdown seems to be analysed to death using historical sequences going back 100 or even 200 years, but the same isn't done for flat annuities. Inflation risk isn't analysed in the same way as stockmarket risk. It should be. It's as if people assume inflation risk is a thing of the past. I'll give it a go...MK62 said:
All true, but it rather assumes your whole retirement income comes from said annuity alone........if you split your pot so that your income is part annuity/part drawdown, then you should also model what happened to the drawdown part of the pot during the same periods......zagfles said:
Yes sequence of inflation is very important, just as important as sequence of returns when talking about drawdown. But I suspect most people, maybe even advisors, who model flat vs RPI annuities just assume constant inflation.OldScientist said:
While I agree that front loading using a level annuity is a reasonable case (IMO, probably the only reasonable one) but the outcome depends on sequence of inflation. A run of nasty years (annual inflation of 20% plus occurred several times in the UK in the 20th century) very early on after purchase will destroy the purchasing power of a level annuity in both the short, and particularly, the long term. How expensive IL protection turns out to be can only be determined in retrospect (if inflation is low, then very expensive, if inflation is high, very cheap!).arthur_fowler said:
Yes, of course mitigating inflation risk entirely is possible but it is very expensivezagfles said:
1) If private sector DB pensions which usually have caps on inflation increases, that's even more reason to mitigate with something fully inflation protected. A decade like the 1970's would about halve the DB pension value if inflation increases are capped at 5%. Even one off high inflation will permanently dent a DB pension in payment, a single year of 10% as we've seen recently would chop about 5% real value off a DB pension if capped at 5% inflation increase, or 7% if capped at 3%, every year into the future, even if inflation returns to 2% or so.arthur_fowler said:
Again, it depends......zagfles said:
I can't see the point of flat annuities. You just replace investment risk with inflation risk. Even IFAs don't seem to understand this when they waffle on about breakeven points based on guesses about inflation. The point of an annuity isn't to do what maximises lifetime income. Use drawdown for that. The point is to provide a guaranteed income for the rest of your life to pay bills, shopping etc, which will likely increase with inflation, which is unknown just like stockmarket returns.
For us a flat annuity I believe was the correct route to take. Rationale is:
1) We have various DB pensions plus full SPx2 that will kick in over the next 7 years (retiring at 60). These will mitigate (but not remove) inflation risk
2) We want a (relatively) higher income in the next ten years while we are hopefully fit and well enough to travel a lot (which is what we like to do).
(It's not so bad in deferment as the cap applies across the entire period of deferment, but once in payment lumpy inflation can serious dent DB pensions)
2) Front loading retirement spend may be sensible but a flat annuity fronts loads by an unknown amount. You can easily front load retirement income to get predictable real income for instance using an IL gilts ladder, or a short term annuity, in addition to a lifetime IL annuity.
I've modelled retirement at 65 assuming that the uplift for a flat annuity is 56% (as per Annuity Rates: View Best Annuity Rates from the UK Market)
At 3% inflation, the flat annuity pays more until age 80 and the cumulative (real term) total income is higher for flat until 98. Looks like a no-brainer, right?
Even at 5% inflation, the flat annuity pays more till 74 and the cumulative is more till 85.
But put in some real sequences.
1970: the flat pays more for just 4 years, till 69, and the cumulative total is more till just 73. At 74 you're now down overall and living on an income a third of the initial real value and half what you'd have had with an index linked annuity. By age 80 your income is less than 20% of its initial value and 30% of the index linked annuity.
1980: the flat pays more till age 72 and the cumulative cut over is age 80, when you're now on 70% of what the IL would have paid and reducing in your 80's down to 55%
1990: A lot better for flat, pays more till age 80 and the cumulative cut over would have been last year, age 98.
2000: Flat pays more till 81, cumulative cut over not happened yet (now aged 89), current income just under half initial and 76% of what an IL would have been.
So a flat annuity would have been a disaster in 1970, it would have been bad in 1980 assuming average life expectancy, and it would have likely been better in 1990 and 2000. But the downside of a 1970's like start is far worse than the upside of later years.
In 1970 the basic state pension was £260 a year. Not really enough to live on, but plenty of people did. Someone then who was retiring and had built up a massive pension pot of £10k would have done very well. £10k was a massive amount of money then, enough to buy a 4 bed detached house in a decent area of London.
What are they going to do with that £10k? (assuming today's pension freedoms/option)
1) Buy a flat annuity at say £750 a year. That plus the state pension of £260 would be a 4 figure income, a target in those days, around the average wage and a luxury retirement then. Maybe they'd be worried about inflation. Buy why? Inflation had averaged 3.5% over the previous 10 years, and under 4% over the previous 20. Inflation wouldn't have looked any more of an issue then than now.
2) An index linked annuity at £480 a year. Total of £740 a year. Still a good retirement income, but below average wage.
3) Go into drawdown, say drawing 4.5% increasing with inflation. Even less income. But hindsight says that would be worked according to https://forums.moneysavingexpert.com/discussion/comment/80495432#Comment_80495432
4) Or a mix, say a flat annuity with 2/3rds of the pot and drawdown with a third. We can draw more because we have the "security" of the flat annuity, haven't we? So £500 annuity and 7.5% drawdown on £3333 giving £250. Got our 4 figure income with the state pension.
By 1980 (age 75):
1) would be living on an income of £2162 (£750 annuity plus £1412 state pension). Average wage then was £6000. They'd have gone from living on an average wage to living on just over a third of the average wage.
2) would be living on £2972 (£1560 annuity plus £1412 state pension), about half the average wage.
3) would be about £2850, slightly lower than 2)
4) would be £2712 even if the 7.5% drawdown increased with inflation. However the pot would be running dangerously low if they'd done that.
By 1990 (age 85):
1) would be living on an income of £3189 (£750 annuity plus £2439 state pension). Average wage was £15k.
2) would be living on an income of £5615 (£2439 state pension plus £3176 annuity)
3) would be be living on £5417
4) would be living on £2939 as the drawdown pot would have probably run out. Either than or they'd have had to reduce the DD and cut their spending to the bone. Utter disaster.
So it seems mixing a flat annuity with drawdown proves even worse than using the whole lot for a flat annuity in the worst case scenario (ie 1970). Pure drawdown gives a much better result, but not as good as an IL annuity.
In the end though, there is no way way to know which will prove the better option........annuity providers price them so that, on average there will be no difference......half the time an IL annuity will be the better option and half the time a flat annuity will be.A far better mix would likely be an index linked annuity with drawdown. You can use the IL annuity to secure a guaranteed real terms income you're happy with, and then it doesn't really matter what happens to the drawdown, you can spend it all in the early years on luxury holidays etc and if it does well that could last for 20 years, if it does badly maybe 10 years, but you know you'll be OK when it runs out. You don't know that with a flat annuity.Again true, but then it's also true that securing an income you are happy with will cost a lot more if you use an IL annuity.......and will leave you with a smaller drawdown pot which will likely run out sooner......you can't have it both ways.
If you want £10k as a base income from an annuity, then for a 60yo that will cost £148k for a flat annuity and £232k for an index linked version. So, taken to the nth, in effect it becomes a £10k index linked annuity versus a £10k flat annuity coupled with withdrawals from an £84k drawdown pot.......there is no way to know today which option will turn out to have been the better choice.
0 -
westv said:
But nobody would invest their pension 100% in the UK.OldScientist said:As a specific example, here is an historical case starting in 1937 with a target constant inflation adjusted total income of 3.5% for four scenarios (the income is plotted in real terms). The first is where no annuity was purchased (50% UK equities, 50% UK gilts), and the next three all involve using 40% of the initial portfolio to purchase a level annuity (assuming an age of 67) with payout rates of 4.8%, 5.8%, and 6.8% (more on these values below). After purchase, the remaining portfolio is held at 80% equities and 20% gilts to roughly keep the overall allocation close to 50/50.
Which does not invalidate the outcomes from the simulation at all since changing the assets makes a relatively tiny difference historically (perhaps 20-30 bp in terms of SWR) and so UK assets represent a realistic historical worst case for UK retirees (not a bad idea for retirement planning). Future conditions are, of course, unknown and may be worse, or better, than either the historical UK or international cases.
0 -
The BOE has no direct control over imported inflation i.e. energy price shocks. As a result actions taken can only be reactive. Changes in the BOE base rate take some 18 months to reach and have a full effect on the real economy. There's no magical levers to pull.zagfles said:
Yet 2 years ago CPI was over 11% and RPI over 14%.Hoenir said:
The BOE is now mandated to hold inflation at around the 2% level.DRS1 said:What interests me is what inflation rate insurers assume when pricing IL annuities. The prices I got earlier in the year showed that an IL annuity was cheaper than one with flat 5% increases built in. Maybe they have forgotten the 1970s?0 -
I agree with your sentiment when it comes to the markets, no one truly knows and if they did they'd be billionaires. However, they are very well versed in how to maximise tax efficiency around legislation. I spoke with one for a one-off fee of £250. She advised me of the sequencing of some property sales and purchases and my upcoming remarriage and CGT that will save me tens of thousands of pounds in completely avoidable tax just by resequencing the order of these things. A good IFA or tax advisor really can be worth their weight in gold.dont_use_vistaprint said:Cobbler_tone said:Has to totally individual based on circumstances. For some it may be their only pension and they want certainty until they meet their makers.
For me it will be a basis of a modest DB pension and a flexi drawn down of a DC pot to smooth me to state pension age. I haven't even thought about the timings and order....i.e. bridging the DB, delaying the DC, or using the DC and delaying the DB etc. I think I might get an IFA as opposed to trying to crunch the various options myself.I just used a spreadsheet showing each row as one year with columns for regular spend, big projects, tax, travel etc. as well as savings interest and any other incomes, lump sums, then , recalculates in the last column end of year value which it copies into the start of the next row and repeats the process. Its 100% dynamic So you can quickly model projected interest CPI, investment return rates and then look at the final column.
Each row shows the year and my age (which is very useful for populating the travel and projects columns) and then different points in time showing DBP and SP starting, DD Starting and ending, everything is linked to calculations for RPI, CPI and savings and investment growth rates using the same numbers as the pension providers tool for low, medium and high and a table from LGPS is linked showing the percentage reductions to pension and lump sum up to 12 years , so you can clearly see the impact of taken a DBP a few years earlier versus delaying.If you have some inheritance due or plan on downsizing your property later on you simply add a negative amount into one of the projects columns for that year and everything updatesI’m not sure what an IFA could add to this unless they have a crystal ball1 -
At the end of December 1999, the yields for 20 years gilts were 4.4% (nominal) and 1.8% (real) which (assuming a current life expectancy of 19.5 years) would have given single life payout rates at 67 of about 7.4% (level) and 6.0% (RPI). £100k spent on an annuity in 2000, would have provided initial incomes of £7400 (level) and £6.0k (real) and would now be providing £4k and 6k, respectively (I've used CPIH).MK62 said:
Run a simulation from 2000 and the reverse is true.......the IL annuity would have proved costly if used alongside drawdown.
In the end though, there is no way way to know which will prove the better option........annuity providers price them so that, on average there will be no difference......half the time an IL annuity will be the better option and half the time a flat annuity will be.A far better mix would likely be an index linked annuity with drawdown. You can use the IL annuity to secure a guaranteed real terms income you're happy with, and then it doesn't really matter what happens to the drawdown, you can spend it all in the early years on luxury holidays etc and if it does well that could last for 20 years, if it does badly maybe 10 years, but you know you'll be OK when it runs out. You don't know that with a flat annuity.Again true, but then it's also true that securing an income you are happy with will cost a lot more if you use an IL annuity.......and will leave you with a smaller drawdown pot which will likely run out sooner......you can't have it both ways.
If you want £10k as a base income from an annuity, then for a 60yo that will cost £148k for a flat annuity and £232k for an index linked version. So, taken to the nth, in effect it becomes a £10k index linked annuity versus a £10k flat annuity coupled with withdrawals from an £84k drawdown pot.......there is no way to know today which option will turn out to have been the better choice.
While I am no actuary, my understanding is that insurance companies price them based on liability matching using (for nominal annuities) the yields of both government and corporate bonds and (for RPI annuities) inflation linked gilts and contemporaneous expectations of mortality. Predictions of inflation (save those of implies by the market yields of nominal and IL gilts) are not included (although prior to the issue of IL gilts, DB pension schemes did have to attempt to include predictions of inflation if they offered inflation linked payouts).
I completely agree with you that at the beginning of retirement, there is no way of predicting which type of annuity (level or RPI) will be better. On the one hand, level will give more immediate income (or as you say, the same initial income with more left in the portfolio) but with inflation risk later on, while the RPI annuity will give certainty of lifetime income in real terms, but potentially with the risk to upside spending.
1 -
Finally, since I said I'd include another couple of historical cases, here are 1910 (fairly bad for stock/bond portfolio) and 1970 (actually OK for stock/bond portfolio - note the target WR of 5% instead of 3.5% - but horrible inflation). In each case, the highest annuity payout rate is for a single life level annuity aged 67 based on historic yields and modern mortality rates.


For the 1910 case there was deflation during the 1920s (that's why the income from the annuity goes back up - IIRC, the last occasion when we had some deflation in RPI was 2008). The large effect of inflation on the annuity income during the 1970s can also be seen and the annuity only marginally improves things even at the highest payout rate. However, in each of the example cases, provided the payout rate was high enough, the level annuity improved the outcome compared to just running drawdown. In some respects, this should not be too surprising since the retiree is swapping bonds held in their portfolio for a collapsing bond ladder held by the insurance company (with a small boost due to mortality rates).
I've looked at this in a more systematic way and found that provided the payout rate for a level annuity exceeded a threshold of somewhere between 5.5 and 6.0% it would have improved the outcomes for the worst historical cases in the UK.
0


Confirm your email address to Create Threads and Reply

Categories
- All Categories
- 354.8K Banking & Borrowing
- 254.5K Reduce Debt & Boost Income
- 455.6K Spending & Discounts
- 247.6K Work, Benefits & Business
- 604.6K Mortgages, Homes & Bills
- 178.6K Life & Family
- 262.2K Travel & Transport
- 1.5M Hobbies & Leisure
- 16.1K Discuss & Feedback
- 37.7K Read-Only Boards