We’d like to remind Forumites to please avoid political debate on the Forum.
This is to keep it a safe and useful space for MoneySaving discussions. Threads that are – or become – political in nature may be removed in line with the Forum’s rules. Thank you for your understanding.
📨 Have you signed up to the Forum's new Email Digest yet? Get a selection of trending threads sent straight to your inbox daily, weekly or monthly!
The Forum now has a brand new text editor, adding a bunch of handy features to use when creating posts. Read more in our how-to guide
Solar Panels - 6.5 months in

LateStarter
Posts: 394 Forumite


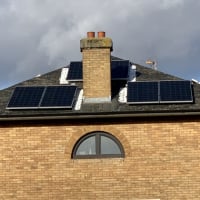
SO, I had a system installed at the end of April (5.2kW of panels, 5kW inverter) and I guess I've been through the peak months now, so here's my feedback/questions for those interested.
- On a "good" day, I seem to generate more than 30 kWh. On a "great" day, it's more than 35kWh. I've only had a couple of great days per month, and never gotten to 40 kWh.- so 8x installed capacity seems to be unachievable by my system. Does anyone else have a figure to compare?
- My roof faces SSW. In the summer months I generate very little after 5pm. We both work, so most of our import seems to be during peak. And I sit in the garden and look at the lovely sunshine on the north side of my roof - does it make send to invest in panels there?
- For the 5 months so far, I've generated 3.6 MWh, and exported 2.1 MWh - so used 1500 kWh. I've also imported about 550 kWh, meaning I got about 75% of my electricity from solar.
1
Comments
-
You will not be generating peak at 5pm but with SSW facing panels it should still be very significant. Many posters have W facing panels catching evening solar.Might be worth a look at the generation curve on a good day (full sun would be ideal) for one of the best day this year if you have that capability. A cool day will give you best output so can maybe benchmark your actual output and see if there are any issues such as shading.Post a copy of the chart on here if you can.I expect someone will be along to guide you through PVGIS to do a theoretical comparison for your general location if you care to post it.1
-
There are no tall tress on the south side, so no shading. Here's the generation chart from my most recent 35kWh day.

0 -
That's a good looking curve you have there. Clearly no shading at this time of year (although as get into the months when the sun is lower you may well find shading caused by things you least expected).
It's very unlikely you'll get decent return/production from a north facing orientation. I wouldn't even look at it myself. In the best months the sun starts quite northerly and sets fairly northerly too. But between Autumn and Spring it's unlikely the sun will hit that side of the house for a decent time. Where I am on the 21st June the sun rises at 46 degrees and sets at 314 degrees. However at the other extreme on the 21 Dec the sun rises at 131 degrees and sets at 229 so barely a 100 degree window of sun. (Also in summer the sun gets to 59 degrees above the horizon but mid winter it's 13 degrees.)Install 28th Nov 15, 3.3kW, (11x300LG), SolarEdge, SW. W Yorks.
Install 2: Sept 19, 600W SSE
Solax 6.3kWh battery3 -
Agree 100% ^Your system is performing admirably. The SSW aspect is reflected in the sharper morning half of the curve.- 10 x 400w LG Bifacial + 6 x 550W SHARP BiFacial + 2 x 570W SHARP Bifacial + 5kW SolarEdge Inverter + SolarEdge Optimizers. SE London.
- Triple aspect. (33% ENE.33% SSE. 34% WSW)
- Viessmann 200-W on Advanced Weather Comp. (The most efficient gas boiler sold)Feel free to DM me for help with any form of energy saving! Happy to help!1 -
LateStarter said:SO, I had a system installed at the end of April (5.2kW of panels, 5kW inverter) and I guess I've been through the peak months now, so here's my feedback/questions for those interested.
- On a "good" day, I seem to generate more than 30 kWh. On a "great" day, it's more than 35kWh. I've only had a couple of great days per month, and never gotten to 40 kWh.- so 8x installed capacity seems to be unachievable by my system. Does anyone else have a figure to compare?
- My roof faces SSW. In the summer months I generate very little after 5pm. We both work, so most of our import seems to be during peak. And I sit in the garden and look at the lovely sunshine on the north side of my roof - does it make send to invest in panels there?
- For the 5 months so far, I've generated 3.6 MWh, and exported 2.1 MWh - so used 1500 kWh. I've also imported about 550 kWh, meaning I got about 75% of my electricity from solar.
1. My system was installed in June (South facing, no shade). Our best day (June, close to the longest day) has produced 7.15x our installed array size (26kW from a 3.645kWp array). My app showed a near perfect generation curve for the day with zero irradiation lost from cloud cover and it wasn't too hot either. Best day in July was 25.4kW and 24.7kW in August (days getting shorter, sun lower in sky), so anything around 7x installed capacity (36-37kW for you) I'm guessing is the maximum you are likely to achieve (although interestingly sometimes surrounding white clouds can give an effect known as cloud enhancement due to reflected irradiation from the clouds)2. Your export percentages in (3) look very reasonable at 58% exported, hence 42% of generation consumed. We are home all day and have struggled to consume more than a third of what we generated during June-Aug (no batteries / diverters etc). That percentage will no doubt increase in the non-summer months, and maybe your figure is higher than ours as your numbers also include end of April and May.Definitely head over to the PVGIS system website and take a look at what they say you should be generating:Pick your location from the map, then select your mounting (roof), slope and azimuth (0deg is due south), then click visualise results. So far my predicted generation has been surprisingly accurate (compare with your own first 5 months) and I'm lucky that my roof is near optimal. You can use it to model other orientations to see how that may affect generation to decide if other roof aspects are worth the investment. It should also highlight any issues with your system pretty quickly, if you are not achieving close to the predicted output over a given month. It's a really great resource I keep returning to.
Our green credentials: 12kW Samsung ASHP for heating, 7.2kWp Solar (South facing), Tesla Powerwall 3 (13.5kWh), Net exporter0 -
If you have got a raspberry pi or other little server, well worth installing HomeAssistant. Bit of a fiddle to setup, but you can get Solar prediction versus actual. Here's my July data (also installed in June this year), from a 6.75Kw array with a 5Kw inverter SSE orientation at 41 degrees. Data I believe is from PVGIS.

Got it working in early July, it mostly tracks the prediction (dotted line) , August I had an issue, so no full stats. It's not perfect but when I can get it working with batpred, it will automatically manage my export and battery6.75kwp (15 * 450W) SSE facing
5KW Solaredge Homehub
9.7KWh Solaredge Battery
Sunny(ish) Berkshire2 -
Great comments above. Your evening and morning generation are significant just not by comparison to the middle parts of the day.Generation curves are interesting as they can tell quite a story. For comparison I attach mine for 8th June for a 4kWp system.
 Taken from Zappi.Several things to note amongst themLower peak genLots of clouds going over ( been a bad year overall ) that show up the variations and mask much early morning gen -unlike most of the eveniingMuch longer ( rel to your) generation as shallow pitch roof of mine 22.5 deg and (probably?) much further North with longer daylight hours.The lower peak generation but overall is not too bad gen overall in comparison to your excellent day ( prorata etc. and ignori g the clouds). Helped by roof pitch at the day extremes and due S facing.Early and late in the season mine would show a quite inferior generation curve!1
 -
Can I ask which integration you get your forecast from? I've tried the standard "Forecast.Solar" but found it not to be accurate at all. Normally it underestimates, but on bad days it can be wildly optimistic (yesterday's forecast 17.8, actual 5.5).charles_b_2 said:If you have got a raspberry pi or other little server, well worth installing HomeAssistant. Bit of a fiddle to setup, but you can get Solar prediction versus actual. Here's my July data (also installed in June this year), from a 6.75Kw array with a 5Kw inverter SSE orientation at 41 degrees. Data I believe is from PVGIS.1 -
I'm using the Solcast integration(installed using HACS). You need to create an account where you specify the location, array size and inverter size. Free version I think allows 2 aspects. Configure Solcast by pasting in your API key. Then create an automation to call it - you are limited to a number of API calls per day. You can then use the sensor in your energy monitorQyburn said:
Can I ask which integration you get your forecast from? I've tried the standard "Forecast.Solar" but found it not to be accurate at all. Normally it underestimates, but on bad days it can be wildly optimistic (yesterday's forecast 17.8, actual 5.5).charles_b_2 said:If you have got a raspberry pi or other little server, well worth installing HomeAssistant. Bit of a fiddle to setup, but you can get Solar prediction versus actual. Here's my July data (also installed in June this year), from a 6.75Kw array with a 5Kw inverter SSE orientation at 41 degrees. Data I believe is from PVGIS.
6.75kwp (15 * 450W) SSE facing
5KW Solaredge Homehub
9.7KWh Solaredge Battery
Sunny(ish) Berkshire0 -
Thanks, a search for "Solcast" on HACS doesn’t immediately find anything. Looks like the project had a bit of a meltdown, and the rebirth isn’t yet in HACS.I'm using the Solcast integration(installed using HACS). You need to create an account where you specify the location, array size and inverter size. Free version I think allows 2 aspects. Configure Solcast by pasting in your API key. Then create an automation to call it - you are limited to a number of API calls per day. You can then use the sensor in your energy monitor0


Confirm your email address to Create Threads and Reply

Categories
- All Categories
- 354.2K Banking & Borrowing
- 254.4K Reduce Debt & Boost Income
- 455.3K Spending & Discounts
- 247.2K Work, Benefits & Business
- 603.9K Mortgages, Homes & Bills
- 178.4K Life & Family
- 261.4K Travel & Transport
- 1.5M Hobbies & Leisure
- 16.1K Discuss & Feedback
- 37.7K Read-Only Boards