We’d like to remind Forumites to please avoid political debate on the Forum.
This is to keep it a safe and useful space for MoneySaving discussions. Threads that are – or become – political in nature may be removed in line with the Forum’s rules. Thank you for your understanding.
📨 Have you signed up to the Forum's new Email Digest yet? Get a selection of trending threads sent straight to your inbox daily, weekly or monthly!
The Forum now has a brand new text editor, adding a bunch of handy features to use when creating posts. Read more in our how-to guide
Gilts, US Treasuries, or both?
Comments
-
What matters is what happens to interest rates, not equities, and interest rates need to be set with reference to both the economy and inflation.
That might be how interest rates should work. But in reality the Fed (like the BoE) is a branch of government. And Biden has recently said: ‘It’s (interest rates) going to come down’.
https://www.bloomberg.com/news/articles/2024-03-08/biden-bets-fed-will-cut-rates-as-he-pledges-housing-help?embedded-checkout=true
Some say that rates should and need to be higher, not lower. But consensus seems to be that rates will come down. And then we'll have £10 milk to look forward to!
If though rates do go up, how will that affect the capital that I put into the three bond funds (one Gilts ETF and two Treasuries ETFs). What affect would say, a 50bps rise in interest rates have on £20K spread over those three funds?
0 -
OldScientist said:
Given a price of roughly £10.5 and longer term yields of about 4% then, assuming gilt yields do not change again (highly unlikely, but go with it), the accumulating version of the fund would recover to a value of about £15 in about 9 years time (i.e., not too far from the duration of the fund). I presented a few simulations of this in the threadaroominyork said:1404 said:masonic said:1404 said:
I would like something which will preferably go up when the market crashes. Not something which will itself crash. I'm not looking to short the market.masonic said:
Perhaps it would be better to think about what outcome you want from an investment "in case of a crash", and then it may be possible to assess whether there is a suitable option available. The answer will be different depending on whether you want something that will pay out a guaranteed sum on a particular date vs something that might go down but nowhere near as much as equities vs something that may go up when equities go down but could crash itself.1404 said:I would like to have some bonds in case of a crash.A gilt fund would be an example of something that may go up when the market crashes but can crash itself. Other examples would be gold and commodities. I'm not aware of any investment where you can decouple the two and get something that will go up when the market crashes but has a low loss potential. You are probably asking the impossible.
To get that to any appreciable extent, you must hold a longer duration fund, but that will give you interest rate risk. A vanilla gilt fund can (and recently has) gone down 30%+. Maybe a fall of that magnitude is once in a lifetime, but 10-20% falls would not look that out of the ordinary. Here is IGLT, which you proposed above:1404 said:
I'm happy to keep a chunk of money (15%-30% of my investible funds) in cash for this eventuality. I've been doing this for a while. But I was thinking that by having bonds I may actually see some capital gains when the crash happens.
Looking at that chart, now seems like a good time to buy that fund. It is at a historical low.Not necessarily. It has not fallen to a bargain price the way you might view a developed world equities chart. It has simply reversed the rises of the post-GFC QE/low interest rates years. Interest rates are now back to 'normal' levels (add as many inverted commas as you like around that) and the price of the fund reflects that, because the gilts it holds will mostly be paying very low coupons compared to new issues, so the fund price has fallen to reflect that. Don't expect the price to bounce back to £15.
https://forums.moneysavingexpert.com/discussion/6470635/how-long-do-bond-funds-take-to-recover-after-a-sharp-rise-in-yields
Is your post assuming that we have 9 years of no crashes and no recessions?
Most of my reasoning for wanting Gilt/Treasuries exposure is because I believe that something will break. If I did not believe that then I wouldn't bother with bonds at all. I would be in equities all the way.1 -
coastline said:Just as many say the US equity markets are overvalued and in a bubble then it could be argued the gilt/bond market was also in a bubble . Who would have imagined a decade long period of near zero rates. ? That's history now . Here's that chart from earlier and I'm using 2005 as a reference point. Nearly 20 years apart from income . As suggested earlier current rates could be considered " normal " ??
b6zn3lv0kwre.png (662×436) (v-cdn.net)
The M&G Gilt fund with a reasonable benchmark included . Even before the pandemic there's still volatility but not enough to cause investors to question their asset allocations. Could be argued everyone is happy ? Now set the same chart from 2005 -2024. The M&G fund is up around 50%.
Chart Tool | Trustnet
Hopefully this has worked with the 2005-24 period
[img]https://i.postimg.cc/bwHB8ZpW/image.png[/img]
Just for an idea I've selected the same period 2005-24 in the base rate accumulator and it's 37% and currently running 5.25% PA ? . 50% is better than 37% no doubt but we ain't got no volatility which has been a major concern to many investors. Even in calmer waters there's still 10% volatility with gilts/bonds. Maybe use a STMMF , gilt/bond and platform cash ? That equity crash mentioned could be topped up from platform cash ? All speculation.
Actuarial Solutions | Base Rate Roll-up - Actuarial Solutions (aprllp.com)
The three bond ETFs I'm looking at don't seem to be in a bubble. IGLT (Gilt ETF) and VUTY (Treasuries ETF) seem to be at historic lows. The other Treasuries ETF (IBTM) seems to be not at a low, but about at its average.
If you are comparing these to the actual bubble which equities are in, particularly the Mag7 - and especially Nividia - then these bond funds are not comparable bubble-wise.


0 -
1404 said:
That might be how interest rates should work. But in reality the Fed (like the BoE) is a branch of government. And Biden has recently said: ‘It’s (interest rates) going to come down’.What matters is what happens to interest rates, not equities, and interest rates need to be set with reference to both the economy and inflation.
https://www.bloomberg.com/news/articles/2024-03-08/biden-bets-fed-will-cut-rates-as-he-pledges-housing-help?embedded-checkout=trueWe've seen what happens when governments deny basic economic realities during the period following the KamiKwasi budget. It does not matter who you think is in control of interest rates. They need to be set with reference to both the economy and inflation. Otherwise bad things happen. The fact of the matter is that politicians are even less reliable than economists when it comes to these matters, and I wouldn't have faith in statements uttered by either at a specific moment in time. At the end of last year UK economists were predicting the first rate cut taking place in 2-3 months time. Fast forward 3 months, and they are predicting it will come in about 3 months time. Over in the US, back in December, the CME FedWatch tool predicted the most likely outcome for June was a target rate of 4.75% (i.e. 3 x 0.25% cuts by then), whereas now they are predicting the first 0.25% cut will come then with almost a 1 in 3 chance of no cut. Biden prefaced his comment with "I can't guarantee it", but as he put no timescale on it, he is sure to be right eventually.1404 said:Some say that rates should and need to be higher, not lower. But consensus seems to be that rates will come down. And then we'll have £10 milk to look forward to!To the extent there is a consensus, that will already be priced in to bond markets. The market reaches a consensus on what cashflows need to arise from each financial instrument trading on the market to make them sufficiently attractive vs overnight inter-bank rates etc. Meanwhile, news flows, actions are taken, and market price discovery takes place. If some of these factors were unexpected, then they will impact price.Of course, if you think the market consensus is wrong, and for example the current weighted average YTM of 4.2% for IGLT is overestimating future gilt yields over the 12 weighted average duration of the fund, then of course you could buy now while it is undervalued. But buying such a fund explicitly for a capital gain is not really any different than trying to time the equity market.
Very difficult to estimate, because swings of +/-10% can happen on mere speculation. But in general, the longer the duration, the wilder the ride. That's a particular risk for the Gilts ETF, but with the US Treasuries ETFs you have currency risk to add to the volatility.1404 said:
If though rates do go up, how will that affect the capital that I put into the three bond funds (one Gilts ETF and two Treasuries ETFs). What affect would say, a 50bps rise in interest rates have on £20K spread over those three funds?I wouldn't want any of the above to come across as discouragement for those opting for a long term 60:40 (or indeed any other combination of equities:bonds) portfolio. However, the notion that bonds are currently undervalued and there is an easy capital gain to be had looks specious in my view.0 -
These 504 Gateway Time-Out errors are getting worse
3 -
Yeah read back to what I said.. WAS.1404 said:coastline said:Just as many say the US equity markets are overvalued and in a bubble then it could be argued the gilt/bond market was also in a bubble . Who would have imagined a decade long period of near zero rates. ? That's history now . Here's that chart from earlier and I'm using 2005 as a reference point. Nearly 20 years apart from income . As suggested earlier current rates could be considered " normal " ??
b6zn3lv0kwre.png (662×436) (v-cdn.net)
The M&G Gilt fund with a reasonable benchmark included . Even before the pandemic there's still volatility but not enough to cause investors to question their asset allocations. Could be argued everyone is happy ? Now set the same chart from 2005 -2024. The M&G fund is up around 50%.
Chart Tool | Trustnet
Hopefully this has worked with the 2005-24 period
[img]https://i.postimg.cc/bwHB8ZpW/image.png[/img]
Just for an idea I've selected the same period 2005-24 in the base rate accumulator and it's 37% and currently running 5.25% PA ? . 50% is better than 37% no doubt but we ain't got no volatility which has been a major concern to many investors. Even in calmer waters there's still 10% volatility with gilts/bonds. Maybe use a STMMF , gilt/bond and platform cash ? That equity crash mentioned could be topped up from platform cash ? All speculation.
Actuarial Solutions | Base Rate Roll-up - Actuarial Solutions (aprllp.com)
The three bond ETFs I'm looking at don't seem to be in a bubble. IGLT (Gilt ETF) and VUTY (Treasuries ETF) seem to be at historic lows. The other Treasuries ETF (IBTM) seems to be not at a low, but about at its average.
If you are comparing these to the actual bubble which equities are in, particularly the Mag7 - and especially Nividia - then these bond funds are not comparable
"Just as many say the US equity markets are overvalued and in a bubble then it could be argued the gilt/bond market was also in a bubble ."
The bubble period was 2012 ? until recently when rates were near ZERO. Hardly a period in history under those conditions. It's been suggested " normal " conditions are back with rates between 3-5% . All subject to inflation and economic prospects. Analysts are changing their forecasts subject to the daily data inflows. Look at the chart above the fund price has fluctuated between 950 and 1100 all down to the number of rate cuts expected by the central banks. Look below at the link and this is reflected in the volatility of late . 5%, 3.75% and 4.25%.
US 10 Year Treasury Bond Note Yield - Quote - Chart - Historical Data - News (tradingeconomics.com)
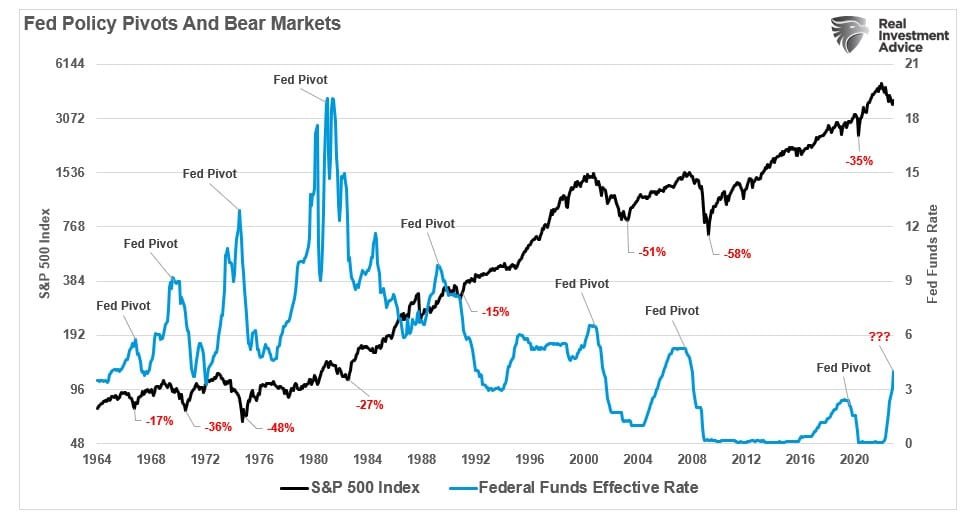
If you think the SP 500 is in a bubble then you're not alone. There again some will argue it's not as it includes TECH . Valuations are aggregate P/E ratios so it's kind of skewed a bit. There again when rates are low as today say 4% then P/E ratios tend to be higher . EG P/E of 20 as today . If rates were say 6% then P/E ratios would probably fall. Simple ballpark rule . 100/4% = 25 so the market maybe will handle high P/E of 20 like today. 100/6% = 16 so maybe markets will fall a fair bit to compensate. Trouble is when US falls then usually the rest follow. Historical data suggests all of this. All speculation and a fine balancing act. I'll say this about history if rates are cut because of an economic slump then market crashes have been bad at times. I'll try to find some links when I've got more time.
Fed-Funds-and-Bear-Markets.jpg (968×519) (realinvestmentadvice.com)
1 -
coastline said:
Yeah read back to what I said.. WAS.1404 said:coastline said:Just as many say the US equity markets are overvalued and in a bubble then it could be argued the gilt/bond market was also in a bubble . Who would have imagined a decade long period of near zero rates. ? That's history now . Here's that chart from earlier and I'm using 2005 as a reference point. Nearly 20 years apart from income . As suggested earlier current rates could be considered " normal " ??
b6zn3lv0kwre.png (662×436) (v-cdn.net)
The M&G Gilt fund with a reasonable benchmark included . Even before the pandemic there's still volatility but not enough to cause investors to question their asset allocations. Could be argued everyone is happy ? Now set the same chart from 2005 -2024. The M&G fund is up around 50%.
Chart Tool | Trustnet
Hopefully this has worked with the 2005-24 period
[img]https://i.postimg.cc/bwHB8ZpW/image.png[/img]
Just for an idea I've selected the same period 2005-24 in the base rate accumulator and it's 37% and currently running 5.25% PA ? . 50% is better than 37% no doubt but we ain't got no volatility which has been a major concern to many investors. Even in calmer waters there's still 10% volatility with gilts/bonds. Maybe use a STMMF , gilt/bond and platform cash ? That equity crash mentioned could be topped up from platform cash ? All speculation.
Actuarial Solutions | Base Rate Roll-up - Actuarial Solutions (aprllp.com)
The three bond ETFs I'm looking at don't seem to be in a bubble. IGLT (Gilt ETF) and VUTY (Treasuries ETF) seem to be at historic lows. The other Treasuries ETF (IBTM) seems to be not at a low, but about at its average.
If you are comparing these to the actual bubble which equities are in, particularly the Mag7 - and especially Nividia - then these bond funds are not comparable
"Just as many say the US equity markets are overvalued and in a bubble then it could be argued the gilt/bond market was also in a bubble ."
The bubble period was 2012 ? until recently when rates were near ZERO. Hardly a period in history under those conditions. It's been suggested " normal " conditions are back with rates between 3-5% . All subject to inflation and economic prospects. Analysts are changing their forecasts subject to the daily data inflows. Look at the chart above the fund price has fluctuated between 950 and 1100 all down to the number of rate cuts expected by the central banks. Look below at the link and this is reflected in the volatility of late . 5%, 3.75% and 4.25%.
US 10 Year Treasury Bond Note Yield - Quote - Chart - Historical Data - News (tradingeconomics.com)
If you think the SP 500 is in a bubble then you're not alone. There again some will argue it's not as it includes TECH . Valuations are aggregate P/E ratios so it's kind of skewed a bit. There again when rates are low as today say 4% then P/E ratios tend to be higher . EG P/E of 20 as today . If rates were say 6% then P/E ratios would probably fall. Simple ballpark rule . 100/4% = 25 so the market maybe will handle high P/E of 20 like today. 100/6% = 16 so maybe markets will fall a fair bit to compensate. Trouble is when US falls then usually the rest follow. Historical data suggests all of this. All speculation and a fine balancing act. I'll say this about history if rates are cut because of an economic slump then market crashes have been bad at times. I'll try to find some links when I've got more time.
Fed-Funds-and-Bear-Markets.jpg (968×519) (realinvestmentadvice.com)
Yes, I have read that recessions come after the first rate cut. Some people think rate cuts are bullish but it's the opposite.2 -
Hot CPI print puts rate cuts on hold then, possibly. Bonds didn't like it.1
-
Yes - as I said, it is unlikely that yields will remain constant over that period, but the calculation gives the 'no change' long term result - if yields trend up, the result will be worse than this, if yields trend down it will be better.1404 said:OldScientist said:
Given a price of roughly £10.5 and longer term yields of about 4% then, assuming gilt yields do not change again (highly unlikely, but go with it), the accumulating version of the fund would recover to a value of about £15 in about 9 years time (i.e., not too far from the duration of the fund). I presented a few simulations of this in the threadaroominyork said:1404 said:masonic said:1404 said:
I would like something which will preferably go up when the market crashes. Not something which will itself crash. I'm not looking to short the market.masonic said:
Perhaps it would be better to think about what outcome you want from an investment "in case of a crash", and then it may be possible to assess whether there is a suitable option available. The answer will be different depending on whether you want something that will pay out a guaranteed sum on a particular date vs something that might go down but nowhere near as much as equities vs something that may go up when equities go down but could crash itself.1404 said:I would like to have some bonds in case of a crash.A gilt fund would be an example of something that may go up when the market crashes but can crash itself. Other examples would be gold and commodities. I'm not aware of any investment where you can decouple the two and get something that will go up when the market crashes but has a low loss potential. You are probably asking the impossible.
To get that to any appreciable extent, you must hold a longer duration fund, but that will give you interest rate risk. A vanilla gilt fund can (and recently has) gone down 30%+. Maybe a fall of that magnitude is once in a lifetime, but 10-20% falls would not look that out of the ordinary. Here is IGLT, which you proposed above:1404 said:
I'm happy to keep a chunk of money (15%-30% of my investible funds) in cash for this eventuality. I've been doing this for a while. But I was thinking that by having bonds I may actually see some capital gains when the crash happens.
Looking at that chart, now seems like a good time to buy that fund. It is at a historical low.Not necessarily. It has not fallen to a bargain price the way you might view a developed world equities chart. It has simply reversed the rises of the post-GFC QE/low interest rates years. Interest rates are now back to 'normal' levels (add as many inverted commas as you like around that) and the price of the fund reflects that, because the gilts it holds will mostly be paying very low coupons compared to new issues, so the fund price has fallen to reflect that. Don't expect the price to bounce back to £15.
https://forums.moneysavingexpert.com/discussion/6470635/how-long-do-bond-funds-take-to-recover-after-a-sharp-rise-in-yields
Is your post assuming that we have 9 years of no crashes and no recessions?
Most of my reasoning for wanting Gilt/Treasuries exposure is because I believe that something will break. If I did not believe that then I wouldn't bother with bonds at all. I would be in equities all the way.
In the short-term, rapid changes in yield lead to changes in NAV roughly as (-change in yield in %)*duration. For example, 'All Stocks' funds currently have a modified duration of about 8.6 years, so a 1 percentage point increase in yields would lead to a drop in NAV of approximately 8.6%, while a 1 percentage point decrease in yields would result in a 8.6% increase in NAV. This is an approximation, but close enough except for large changes in yields or where large changes occur incrementally.
Other available funds have different durations, e.g., ishares 0 to 5 years has a duration of 2.4 years, ishares up to 10 years one of 4.2 years, and ishares over 15 years a duration of about 17 years. As others have said, longer duration leads to a wilder ride!
Of course, it is non-trivial to predict what yields will do in the future.
1


![https://i.postimg.cc/bwHB8ZpW/image.png[/img]](https://i.postimg.cc/bwHB8ZpW/image.png[/img])
Confirm your email address to Create Threads and Reply

Categories
- All Categories
- 354.4K Banking & Borrowing
- 254.4K Reduce Debt & Boost Income
- 455.4K Spending & Discounts
- 247.3K Work, Benefits & Business
- 604K Mortgages, Homes & Bills
- 178.4K Life & Family
- 261.5K Travel & Transport
- 1.5M Hobbies & Leisure
- 16K Discuss & Feedback
- 37.7K Read-Only Boards