We’d like to remind Forumites to please avoid political debate on the Forum.
This is to keep it a safe and useful space for MoneySaving discussions. Threads that are – or become – political in nature may be removed in line with the Forum’s rules. Thank you for your understanding.
📨 Have you signed up to the Forum's new Email Digest yet? Get a selection of trending threads sent straight to your inbox daily, weekly or monthly!
The Forum now has a brand new text editor, adding a bunch of handy features to use when creating posts. Read more in our how-to guide
cFiresim and other simulators in the UK ??
Comments
-
Not convinced this is UK based, if you click on the link below the calculator "Link to the full calculator and implementation details" it goes to a US site https://www.wealthmeta.com/calculator/retirement-withdrawal-calculatorOldScientist said:One free UK based simulator (using historical returns from UK stock market and gilts) can be found atq0 -
Fidelity have a very simple drawdown calculator https://www.fidelity.co.uk/retirement/calculators/pension-drawdown-tool/#
They say it is based on "over 10,000 scenario outcomes"
It came out fairly close to my own rule based modelling using a 2% growth rule.0 -
Anyone use Timeline? It seems to support both couples and UK (and Scottish) tax0
-
I used Timeline because in the past you could get a demo version free, but now they have locked it down so you have to pay an amount that’s prohibitive to individual DIY investors. It is pretty good though - I would definitely use it if you find a way.Qyburn said:Anyone use Timeline? It seems to support both couples and UK (and Scottish) tax0 -
The calculator at the link I gave https://www.2020financial.co.uk/pension-drawdown-calculator/ is indeed UK based. There are several reasons why I am certain that this is the case:GenX0212 said:
Not convinced this is UK based, if you click on the link below the calculator "Link to the full calculator and implementation details" it goes to a US site https://www.wealthmeta.com/calculator/retirement-withdrawal-calculatorOldScientist said:One free UK based simulator (using historical returns from UK stock market and gilts) can be found atq
1) Looking at the info in the 'about this drawdown calculator' where it specifically states that it is UK based and it names the sources of info in 'pension drawdown calculator assumptions' (UK stock and bond returns)
2) The 30 year SAFEMAX is well below what you'd expect for the US. For example, with a 60/40 portfolio and 4% withdrawal, there was a failure rate of about 24%. The withdrawal rate has to be reduced to 2.9% before there were no failures (this can easily be compared with the results from cfiresim where, for 60/40, the SAFEMAX was 3.6% and the failure rate with a WR of 4% was about 4%).
3) FWIW, the outcomes are similar to my own drawdown simulator which uses UK return data from macrohistory.net and various other sources.
However, I'd fully agree with you that the link to the full calculator on the page that you cite is definitely US based given a) the dollar amounts and b) that the outcomes are more akin to cfiresim (except that it appears to use a different set of historical return data instead of the Shiller database used by cfiresim, and it certainly uses a different period, 1928-2023 as opposed to 1870-2023).
1 -
my free version still seems to work okPat38493 said:
I used Timeline because in the past you could get a demo version free, but now they have locked it down so you have to pay an amount that’s prohibitive to individual DIY investors. It is pretty good though - I would definitely use it if you find a way.Qyburn said:Anyone use Timeline? It seems to support both couples and UK (and Scottish) tax0 -
I still have a free demo or similar account. Limited to one "client". Can't remember if there was a trick to getting it set up, for example leaving FCA number blank.Pat38493 said:
I used Timeline because in the past you could get a demo version free, but now they have locked it down so you have to pay an amount that’s prohibitive to individual DIY investors. It is pretty good though - I would definitely use it if you find a way.Qyburn said:Anyone use Timeline? It seems to support both couples and UK (and Scottish) tax0 -
Yes - if you set it up before a certain date it still works, so mine seems to be still working as well. However you can’t set it up that way anymore as it forces you to put in a credit card before you can set up even a single client. I think it says you only pay £1 for the first month so I guess you could pay £1 and then cancel it after a month.cobson said:
my free version still seems to work okPat38493 said:
I used Timeline because in the past you could get a demo version free, but now they have locked it down so you have to pay an amount that’s prohibitive to individual DIY investors. It is pretty good though - I would definitely use it if you find a way.Qyburn said:Anyone use Timeline? It seems to support both couples and UK (and Scottish) tax0 -
Doesn’t that make it pretty useless - is anybody who knows what they are doing going to be invested entirely in UK stocks and bonds? This is where commercial tools are a bit better as they allow you to specify what you are invested in with more categories than just one country or one index.OldScientist said:
The calculator at the link I gave https://www.2020financial.co.uk/pension-drawdown-calculator/ is indeed UK based. There are several reasons why I am certain that this is the case:GenX0212 said:
Not convinced this is UK based, if you click on the link below the calculator "Link to the full calculator and implementation details" it goes to a US site https://www.wealthmeta.com/calculator/retirement-withdrawal-calculatorOldScientist said:One free UK based simulator (using historical returns from UK stock market and gilts) can be found atq
1) Looking at the info in the 'about this drawdown calculator' where it specifically states that it is UK based and it names the sources of info in 'pension drawdown calculator assumptions' (UK stock and bond returns)
2) The 30 year SAFEMAX is well below what you'd expect for the US. For example, with a 60/40 portfolio and 4% withdrawal, there was a failure rate of about 24%. The withdrawal rate has to be reduced to 2.9% before there were no failures (this can easily be compared with the results from cfiresim where, for 60/40, the SAFEMAX was 3.6% and the failure rate with a WR of 4% was about 4%).
3) FWIW, the outcomes are similar to my own drawdown simulator which uses UK return data from macrohistory.net and various other sources.
However, I'd fully agree with you that the link to the full calculator on the page that you cite is definitely US based given a) the dollar amounts and b) that the outcomes are more akin to cfiresim (except that it appears to use a different set of historical return data instead of the Shiller database used by cfiresim, and it certainly uses a different period, 1928-2023 as opposed to 1870-2023).
0 -
Good question. In my view - no not really, for several reasons:Pat38493 said:
Doesn’t that make it pretty useless - is anybody who knows what they are doing going to be invested entirely in UK stocks and bonds? This is where commercial tools are a bit better as they allow you to specify what you are invested in with more categories than just one country or one index.OldScientist said:
The calculator at the link I gave https://www.2020financial.co.uk/pension-drawdown-calculator/ is indeed UK based. There are several reasons why I am certain that this is the case:GenX0212 said:
Not convinced this is UK based, if you click on the link below the calculator "Link to the full calculator and implementation details" it goes to a US site https://www.wealthmeta.com/calculator/retirement-withdrawal-calculatorOldScientist said:One free UK based simulator (using historical returns from UK stock market and gilts) can be found atq
1) Looking at the info in the 'about this drawdown calculator' where it specifically states that it is UK based and it names the sources of info in 'pension drawdown calculator assumptions' (UK stock and bond returns)
2) The 30 year SAFEMAX is well below what you'd expect for the US. For example, with a 60/40 portfolio and 4% withdrawal, there was a failure rate of about 24%. The withdrawal rate has to be reduced to 2.9% before there were no failures (this can easily be compared with the results from cfiresim where, for 60/40, the SAFEMAX was 3.6% and the failure rate with a WR of 4% was about 4%).
3) FWIW, the outcomes are similar to my own drawdown simulator which uses UK return data from macrohistory.net and various other sources.
However, I'd fully agree with you that the link to the full calculator on the page that you cite is definitely US based given a) the dollar amounts and b) that the outcomes are more akin to cfiresim (except that it appears to use a different set of historical return data instead of the Shiller database used by cfiresim, and it certainly uses a different period, 1928-2023 as opposed to 1870-2023).
1) the difference in outcomes between different holdings (i.e., adding non-UK) tend to be much smaller than the differences between retirement starting years. For example, in the following figure, I've plotted the 30 year safe withdrawal rate for a UK retiree holding 60% UK stocks and 40% long UK gilts (labelled as 'UK') and for one holding 30% UK stocks, 30% US stocks, and 40% long UK gilts (labelled as 'UK/US'). From year to year, SWR varies from about 3% to 14%, while the difference between the two curves is typically 0.5 percentage point or less (clearly there are quite a few exceptions where the difference is larger in either direction). BTW, I also note that there are at least 4 different inflation time series for the UK prior to the official adoption of RPI shortly after WWII. The different inflation values introduce further differences of about 20 basis points into the SWRs.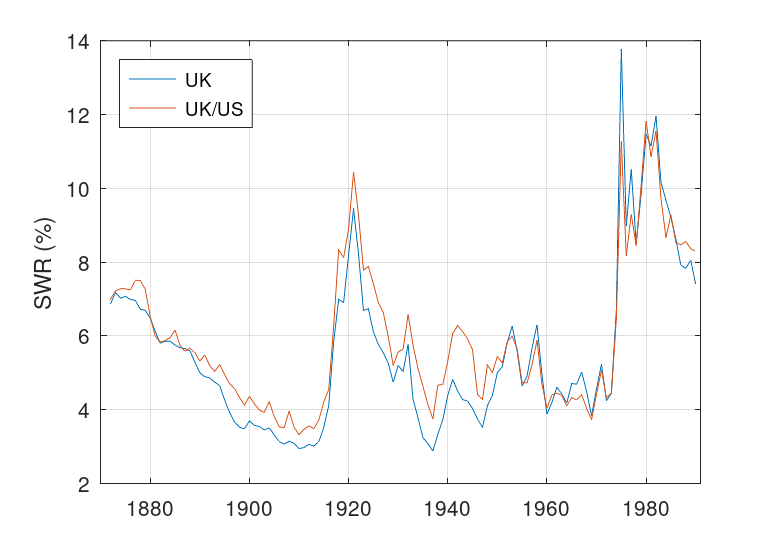
2) The future will not be the same as the past. What the above graph tells us, is that for a 60/40 portfolio, the SAFEMAX for a UK retiree was around 3.0 to 3.5% depending on what was held - since we have no idea what future values might be, and variations with time are very large, fine tuning it to a better precision than that is probably futile.
3) For most retirees in the UK, the level of portfolio income is small compared to guaranteed income. For example, in order to match a state pension of £10.6k with an inflation adjusted withdrawal of 3.5% the retiree would need a retirement pot of just over £300k. According to FCA figures, the median pension pot accessed for the first time is somewhere between £60k and £80k (OK, some people may have more than one). In other words, the size of retirement pots often discussed on this board is unusual in terms of the general population. For a single retiree, taking a pot of £150k and assuming 3.5% inflation adjusted withdrawals*, their overall income would be about £15.9k comprising, £10.6k of state pension and £5.3k of portfolio withdrawals. Let's say, running an analysis with a larger number of indices produces a safemax of 3.8%, then this would increase the total income to £16.3k. If the success of this example retirement is hinging on a precision in withdrawals to about £10 a week, it may not be a terribly robust plan!
* Of course, currently a single retiree at 67 might be better off purchasing an RPI annuity (~4.7% payout rate according to HL) with part of their pot and further reduce any future uncertainty in overall income. But that is a different discussion.
I think the benefits of the commercial simulators (like timeline) is not their databases of stock and bond returns (helpful as that might be), but their ability to incorporate guaranteed income streams starting at different times into a retirement plan. The simulator I linked is not at all sophisticated in this regard (it only allows one state pension and only start year) and hence, in that respect, I'll agree that it is not as useful.
3


Confirm your email address to Create Threads and Reply

Categories
- All Categories
- 354.6K Banking & Borrowing
- 254.5K Reduce Debt & Boost Income
- 455.5K Spending & Discounts
- 247.5K Work, Benefits & Business
- 604.4K Mortgages, Homes & Bills
- 178.6K Life & Family
- 262K Travel & Transport
- 1.5M Hobbies & Leisure
- 16.1K Discuss & Feedback
- 37.7K Read-Only Boards