We’d like to remind Forumites to please avoid political debate on the Forum.
This is to keep it a safe and useful space for MoneySaving discussions. Threads that are – or become – political in nature may be removed in line with the Forum’s rules. Thank you for your understanding.
Generation for August
Comments
-
Freepost said:
I'd appreciate that but only when you get a mo.QrizB said:My August was pretty poor, too. I'll try to provide some actual numbers later tonight.OK, surprising results - at least to me!- My PVGIS estimate for August is 278 kWh.
- August 2023 was 280 kWh.
- August 2022 was 322 kWh.
- August 2021 was 263 kWh.
So it seems my impression was wrong.My "bad August" was pretty much normal. It just seemed poor when compared to last year (which was well above predictions), and was better than the year before.N. Hampshire, he/him. Octopus Intelligent Go elec & Tracker gas / Vodafone BB / iD mobile. Ripple Kirk Hill Coop member.Ofgem cap table, Ofgem cap explainer. Economy 7 cap explainer. Gas vs E7 vs peak elec heating costs, Best kettle!
2.72kWp PV facing SSW installed Jan 2012. 11 x 247w panels, 3.6kw inverter. 35 MWh generated, long-term average 2.6 Os.1 -
Hi Freepost, my gen for August for 2023 was similar to QrizB, at 101% of PVGIS target with generation of 515kWh v's 512kWh target. Previous five years generation was:
2022 - 618
2021 - 496
2020 - 508
2019 - 584
2018 - 498
You can also compare your generation in any given month or year, to the Met Office anomaly maps. So if you have your annual 'target' from checking against PVGIS, then you can see how that compares to the amount that sunlight varied too, against average, for your area, to check that the good/bad/average generation is reasonable v's weather variation.
For August 2023, I can see that my 101% for Cardiff was actually a good result: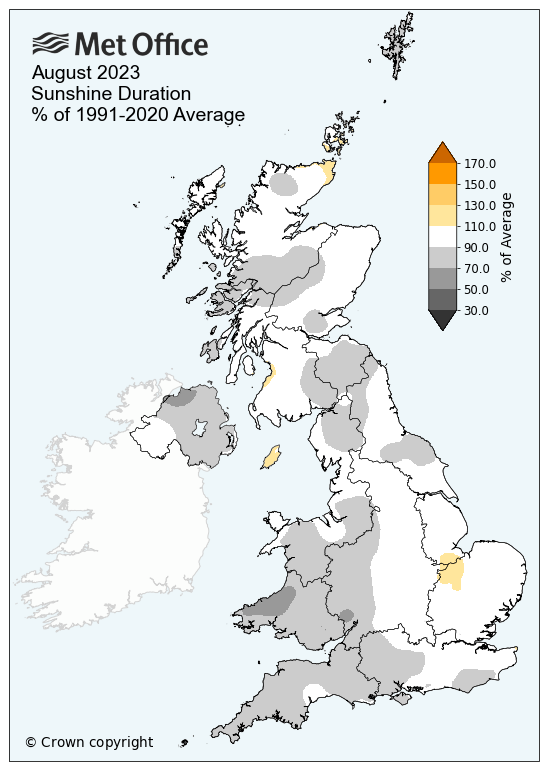
And my 618kWh or 121% for August 2022 was about average, if anything a bit low v's the 130% sunshine level*.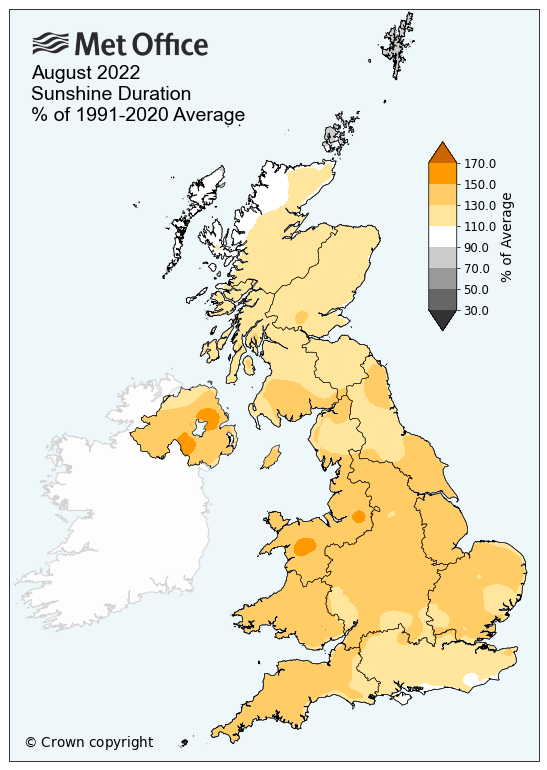
*But makes sense when you take into account the higher than average temps, which would push PV efficiency down a bit: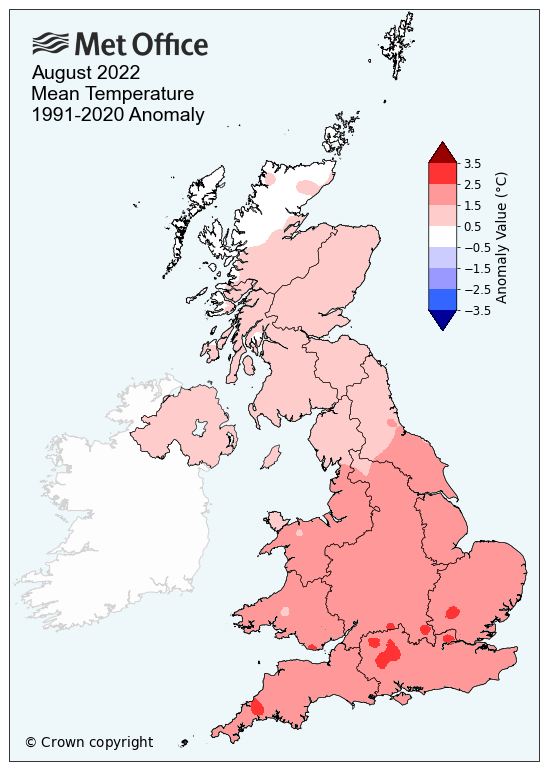
Hope this helps you to double check your numbers, but tbh, looks like you have a problem, maybe you've lost the generation from one string, even if the inverter is 'seeing' V's and A's?
Edit, quick check, and I've ratio'd your gen to mine. For 2021 I have 496 v's 380, a ratio of 1.31:1 and for 2022 we have 616 v's 474 a ratio of 1.3:1.
So taking my 2023 gen of 515 divide it by 1.305 and I get 394.6, then halve that and it's 197kWh, which isn't far off your 212kWh figure?Mart. Cardiff. 8.72 kWp PV systems (2.12 SSW 4.6 ESE & 2.0 WNW). 28kWh battery storage. Two A2A units for cleaner heating. Two BEV's for cleaner driving.
For general PV advice please see the PV FAQ thread on the Green & Ethical Board.1 -
Martyn1981 said:Hi Freepost, my gen for August for 2023 was similar to QrizB, at 101% of PVGIS target with generation of 515kWh v's 512kWh target. Previous five years generation was:
2022 - 618
2021 - 496
2020 - 508
2019 - 584
2018 - 498
You can also compare your generation in any given month or year, to the Met Office anomaly maps. So if you have your annual 'target' from checking against PVGIS, then you can see how that compares to the amount that sunlight varied too, against average, for your area, to check that the good/bad/average generation is reasonable v's weather variation.
For August 2023, I can see that my 101% for Cardiff was actually a good result:
And my 618kWh or 121% for August 2022 was about average, if anything a bit low v's the 130% sunshine level*.
*But makes sense when you take into account the higher than average temps, which would push PV efficiency down a bit:
Hope this helps you to double check your numbers, but tbh, looks like you have a problem, maybe you've lost the generation from one string, even if the inverter is 'seeing' V's and A's?
Edit, quick check, and I've ratio'd your gen to mine. For 2021 I have 496 v's 380, a ratio of 1.31:1 and for 2022 we have 616 v's 474 a ratio of 1.3:1.
So taking my 2023 gen of 515 divide it by 1.305 and I get 394.6, then halve that and it's 197kWh, which isn't far off your 212kWh figure?Hi Martyn,Thanks for detailing your reading and making the comparison although, I'm not sure why the last figure is halved?You metioned that there may be a problem with gereration even if the inverter is seeing the V and As from the panels. If that is the case then it's a fairly easy fix to replace the inverter but I have to prove that is the problem first. I'll monitor the system over the weekend and compare the generation reading from the inverter and the generation recorded by the meter.Thanks for your helpF.1 -
Ah, moving in a few months does put a different spin on things.Freepost said:Chris_Type_R said:
Replacing the inverter and getting some monitoring with it seems a no-brainer, if you can do the swap yourself. I picked up a brand new (other) 3.6kW Solax inverter not long ago off eBay for about £300.Freepost said:The inverter is pretty old now, its an Aurora Power One, installed November 2011 which I had to repair about 4 years ago when the relays had to be replaced, since then okay .......... I'm not aware of an app but perhaps I'm living in the dark ages;-)
Depending on your ability you could measure voltages on the strings to try and diagnose.I don't want to put money into the system unnecessarily because I have to move house in the next 6 months, sure, if the inverter is not working then of course I will replace it but not for the ability to monitor it with an app, although £300 for an Inverter seems a very good price .... having had a quick look on eBay there are some excellent prices for Inverters and if I was staying it would be worthwhile, my FiT is until Nov 2036 and should provide a pretty good income over that period.ThanksF.Central Beds, 2.02kWp (9 x 225W) south facing with some morning shade, installed 2011 (£7.16/Wp). Tigo monitoring/optimisers on all panels, Growatt MIC 2000 TL-X Inverter and Solar iBoost installed 2022. (4 x 415W + 6 x 405W garden experiment connected to SunSynk 3.6 hybrid inverter & 2 x 5.3kWh SynSynk batteries) (4 x 405W panels queued to go somewhere)1 -
When I used to install off grid, we'd be glad with a 10 year inverter service life. Nowadays inverter manufacturers can offer 25 years
If you do replace your inverter, I do recommend optimizers (like SolarEdge). Individual panel level monitoring and protection against panel degradation over time are two benefits that get sidelined by the shading protection benefits of optimizers.
- 10 x 400w LG Bifacial + 6 x 550W SHARP BiFacial + 2 x 570W SHARP Bifacial + 5kW SolarEdge Inverter + SolarEdge Optimizers. SE London.
- Triple aspect. (33% ENE.33% SSE. 34% WSW)
- Viessmann 200-W on Advanced Weather Comp. (The most efficient gas boiler sold)Feel free to DM me for help with any form of energy saving! Happy to help!1 -
Hi. I got the impression from the numbers you supplied, that your August gen looked to be around half of what you'd expect. So I halved my pro-rata to see if it was close. I'm only suggesting half as you have two strings, so unless there is some general problem with the panels or inverter, it might indicate that one string is down, roughly halving your generation (give or take the slight imbalance in the two strings).Freepost said:Martyn1981 said:Hi Freepost, my gen for August for 2023 was similar to QrizB, at 101% of PVGIS target with generation of 515kWh v's 512kWh target. Previous five years generation was:
2022 - 618
2021 - 496
2020 - 508
2019 - 584
2018 - 498
You can also compare your generation in any given month or year, to the Met Office anomaly maps. So if you have your annual 'target' from checking against PVGIS, then you can see how that compares to the amount that sunlight varied too, against average, for your area, to check that the good/bad/average generation is reasonable v's weather variation.
For August 2023, I can see that my 101% for Cardiff was actually a good result:
And my 618kWh or 121% for August 2022 was about average, if anything a bit low v's the 130% sunshine level*.
*But makes sense when you take into account the higher than average temps, which would push PV efficiency down a bit:
Hope this helps you to double check your numbers, but tbh, looks like you have a problem, maybe you've lost the generation from one string, even if the inverter is 'seeing' V's and A's?
Edit, quick check, and I've ratio'd your gen to mine. For 2021 I have 496 v's 380, a ratio of 1.31:1 and for 2022 we have 616 v's 474 a ratio of 1.3:1.
So taking my 2023 gen of 515 divide it by 1.305 and I get 394.6, then halve that and it's 197kWh, which isn't far off your 212kWh figure?Hi Martyn,Thanks for detailing your reading and making the comparison although, I'm not sure why the last figure is halved?You metioned that there may be a problem with gereration even if the inverter is seeing the V and As from the panels. If that is the case then it's a fairly easy fix to replace the inverter but I have to prove that is the problem first. I'll monitor the system over the weekend and compare the generation reading from the inverter and the generation recorded by the meter.Thanks for your helpF.
Mart. Cardiff. 8.72 kWp PV systems (2.12 SSW 4.6 ESE & 2.0 WNW). 28kWh battery storage. Two A2A units for cleaner heating. Two BEV's for cleaner driving.
For general PV advice please see the PV FAQ thread on the Green & Ethical Board.1 -

I do not have a great deal of data yet, but this graph details our estimated PVGIS, actual 2022 and actual 2023 so far. Being on the south coast is no guarantee.2 Separate arrays, 7 x JASolar 380w panels (2.66kWp) south facing, 4 x JASolar 380w panels (1.52kWp) east facing, 11 x Tigo optimizers & cloud, Growatt SPH5000, Growatt 6.5kWh Hybrid battery (Go-live 01/12/21) - Additional reporting via Solar Assistant.0 -
Hi,
I've come home to find that the system has generated approx 13kWh since 9am today, approx 9.5hrs and although it has been a little overcast this afternoon, I would have expected a much higher reading. I have checked the Inverter several times, going through all the readings and it is only now, as the light is fading in the garage that I can see a very faint red light indicating a "ground fault in the DC side of the system" ...... so, it’s not the inverter then!
A "Ground fault on the DC side of the system" ... great, how do I clear this? I have two pairs of cables from the PV Array connected through isolating switches to the Inverter but I'm not seeing an earth wire/cable. I’m assuming that the metal frame that the panels are mounted on to has to be connected to earth ……….. surely this is normal practice? and if it is connected to earth and one of the cables has through wear and tear, stripped the outer insulation layer and made electrical contact with the metal frame it should go ‘BANG’ and blow a fuse but it hasn’t so what’s happening? and how do I measure earth leakage on a live system, taking note that you can’t stop the panels from generating in day light hours?
Your thoughts on this would be most welcome on this little problem.
F.
0 -
Okay, I've found this link;
https://www.fluke.com/en-gb/learn/blog/grounding/dc-ground-faults-pv-systems
In Diagnostic techniques it states that "If there is no ground fault there should be 0 volts to ground from either conductor" ............ that doesn't seem right to me or I'm having a blond moment but if the panels are generating, say 200v and you can measure this on a multimeter then this voltage is floating with respect to earth and it you connect the MM between either of the conductors and earth then you will read a voltage but if one of the conductors is shorted to earth then you would read zero volts between that conductor and earth.
Please be kind, I working on 1970s O level physics here;-)
F.
0 -
Freepost said:
Okay, I've found this link;
https://www.fluke.com/en-gb/learn/blog/grounding/dc-ground-faults-pv-systems
In Diagnostic techniques it states that "If there is no ground fault there should be 0 volts to ground from either conductor" ............ that doesn't seem right to me or I'm having a blond moment but if the panels are generating, say 200v and you can measure this on a multimeter then this voltage is floating with respect to earth and it you connect the MM between either of the conductors and earth then you will read a voltage but if one of the conductors is shorted to earth then you would read zero volts between that conductor and earth.
Please be kind, I working on 1970s O level physics here;-)
My O-levels were in the 1980s so I'm not much better off!If both conductors float, there will be no potential between any one conductor and ground. It's like trying to measure the potential between one terminal of a battery and ground; you have an open circuit, so no potential difference.If there is a ground fault, you will have a circuit from ground to each of the conductors and you will have a potential difference that you can measure.If it was earlier in the day I'd draw you a circuit diagram, but it's too late (sorry). Maybe in the morning")
N. Hampshire, he/him. Octopus Intelligent Go elec & Tracker gas / Vodafone BB / iD mobile. Ripple Kirk Hill Coop member.Ofgem cap table, Ofgem cap explainer. Economy 7 cap explainer. Gas vs E7 vs peak elec heating costs, Best kettle!
2.72kWp PV facing SSW installed Jan 2012. 11 x 247w panels, 3.6kw inverter. 35 MWh generated, long-term average 2.6 Os.1


Confirm your email address to Create Threads and Reply

Categories
- All Categories
- 353.5K Banking & Borrowing
- 254.1K Reduce Debt & Boost Income
- 455K Spending & Discounts
- 246.6K Work, Benefits & Business
- 602.9K Mortgages, Homes & Bills
- 178.1K Life & Family
- 260.6K Travel & Transport
- 1.5M Hobbies & Leisure
- 16K Discuss & Feedback
- 37.7K Read-Only Boards