We’d like to remind Forumites to please avoid political debate on the Forum.
This is to keep it a safe and useful space for MoneySaving discussions. Threads that are – or become – political in nature may be removed in line with the Forum’s rules. Thank you for your understanding.
📨 Have you signed up to the Forum's new Email Digest yet? Get a selection of trending threads sent straight to your inbox daily, weekly or monthly!
The Forum now has a brand new text editor, adding a bunch of handy features to use when creating posts. Read more in our how-to guide
How long do bond funds take to recover after a sharp rise in yields?
Comments
-
A real world fund with a duration of around 10-14 years ( not sure but near ? ) . UK ETF VGOV. If you were unlucky and bought the fund at 2600p then today at 1600p it needs to rise 60% to break even. The nominal yield was always there or not ? I'm not talking (YTR) Yield To Redemption. So where do we get 60% looking at the list below up to 10-15years . Many of those prices are in the £90's today and mature at £100 . I might have it wrong but is the fund price from 2014 to 2021 a blip ? 10 year bond yield was 3% and down under 1% by 2020.
UK Gilt Prices and Yields (dividenddata.co.uk)
VGOV stood at 2000-2200p around 2014 . Realistically ( could be wrong ) I think this will be the region but could be years away ( more like an equity crash recovery.) If there's an economic slump rates will probably be cut so there's some up lift to be had. Set the chart to10 years and UK 10yr bond yield was 3% in 2014 and similar last year . Now yield is 4.5% and in that short time (2022-2023) VGOV has moved from 1600 up to 1800 and back down again. It's not moving a great deal every 1% move in the bond yield.
United Kingdom Government Bond 10Y - 2023 Data - 1980-2022 Historical - 2024 Forecast (tradingeconomics.com)
Vanguard UK Gilt UCITS ETF, UK:VGOV Advanced Chart - (LON) UK:VGOV, Vanguard UK Gilt UCITS ETF Stock Price - BigCharts.com (marketwatch.com)
Yes I understand buying single gilt/bond today and locking in for 4.5% -5% YTR but I can't figure it in a real world fund. Another thing bonds/gilts in a fund will be replaced at maturity . All subject to volatility and events in the future. So that VGOV at 2600p will it happen in a decade ? I can see 2200p ? But what about when gilts stood at a big premium to £100.? Looking at the moves below there's going to be a fair bit of volatility. As I've said there's going to be 1% -2% moves in bond yields in a short space of time. Pretty normal really.
TR30 stood at £150 a few years ago..
Treasury 4.75% 07/12/2030 Share Price (TR30) Gilt | TR30 (hl.co.uk)
FsZwd6qXwAImInR (900×561) (twimg.com)
0 -
The prices (and hence yields) of both nominal and inflation linked gilts are determined by the market (i.e., sellers and buyers) with implied inflation (personally, I prefer the BoE nomenclature to that of the Fed) being the difference in yields.Linton said:
The price of index linked bonds is also fixed mathematically given the yield on fixed bonds of the same duration and the expected inflation in the long term - index linked bonds are generally long term. Expected long term inflation has not changed much. What has changed is that the yield on long term fixed bonds of the same duration has risen dramatically. So people would rather buy fixed rate bonds than pay the previous price of index linked bonds that would have been expected to provide a much lower yield. Hence the collapse in index linked bond prices.
What is surprising to me, is that implied inflation hasn't altered all that much over the period of a) high inflation and b) relatively rapid increases in yields. For example (data from BoE and ONS),
July 2020: 10 year nominal yield=0.13%, 10 year IL yield=-3.06%, implied inflation=3.19%, CPIH=1.1%
July 2023: nominal=4.21%, IL=0.73%, implied inflation=3.49%, CPIH=6.4%
This suggests that the market has not changed much in its preference for nominal or IL gilts (a 40 bp increase in implied inflation mean that IL gilts yields are relatively a small amount lower and hence, prices a small amount higher than if it has remained constant). If inflation persists a bit longer, then implied inflation may increase a bit more - it was over 4% for 10 year maturities earlier in the year when inflation was stubbornly refusing to come down.
0 -
Interest rates are set by the central banks based on their assessment of the economic circumstances.There are lots of interest rates: short term ones, long term ones, ones for corporate bonds with low default risk etc. They are not set by central banks; they set the overnight interbank loan rate, or whatever it’s called in different places. The markets for government bonds and all other bonds set the interest rates for those bonds; if the market suddenly wants more government bonds the market buys them pushing the price up and the yield (interest rate they pay) down.The nominal yield is set by the government when it issues the bond.’The nominal yield is not set by the government, or even the Treasury, when the bond is issued. The coupon is thus set, but the yield is determined by the market. I’m having a deja vu about this.‘Risk is not a factor either since gilts can be deemed risk-free barring end of the world scenarios.’Setting bond prices is as exact as putting a man on the moon, because more important than space exploration is making money. Risk is always a factor; recall gilt yields gyrating when Ms Truss and her right hand man spooked the markets with some crazy tax policy, and the BoE stepped in. It’s all about risk.‘should you really only have to pay <1% to borrow money?’If there’s a lot of money sloshing around and elsewhere to lend to looks too risky, yes.‘nominal interest rates cannot go negative.’Except they did in Japan, Germany, Switzerland and Denmark and Australia. https://www.reuters.com/markets/rates-bonds/japan-unlikely-ditch-negative-rates-another-year-nomura-asset-management-2023-06-07/‘index linked bonds are generally long term’Except there are linkers maturing in 2024, 2026,7,8,9, 2031,2,3,4, etc.
People have different reasons for staying away from bonds.
1 -
1) The overnight rate will have some impact on other slightly longer rates with the effect diminishing the further out you go simply because of the maths
2) In theory QE was abut the central bank trying to manipulate longer rates even if they can not set them directly.I think....0 -
Faffing around with a bond fund simulator is all very well (this is one of my retirement hobbies - I have an exciting life!), but there is a slightly easier way of calculating the effects of changes in bond yields on bond fund prices. You need two pieces of information
a) yield to maturity or YTM (this is not the same as yield which is backward looking). Morningstar generally has this information for bond funds
b) Modified duration (this is not the same as effective duration, although it is close enough to use either, but both are less than maturity) - the units of this are %(price change) per %(yield rate change).
For example, Vanguard U.K. Gilt UCITS ETF (VGOV) at end of July 2023 had a YTM of 4.5% and a modified duration of 9.91. The latter means that if the yield changes by 1%, the NAV will change by 9.91% in the opposite direction (i.e. increases in yields lead to decreases in NAV and vice versa).
Knowing these allows a 'simple' spreadsheet calculation. For example, with constant YTM (using the YTM for VGOV) we get the following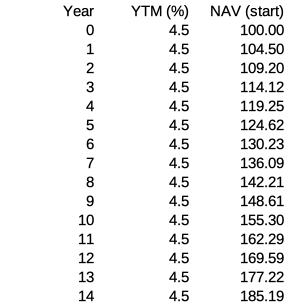
After the first value (i.e. year=0), NAV is (1+YTM(y)/100)*NAV(y-1)
For a single step change in interest rates (assumed to take place at the beginning of a year) we get the following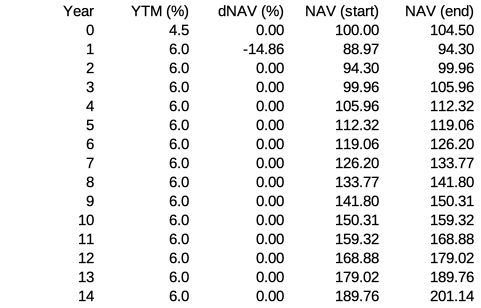
Where, dNAV is 100*((1+(YTM(y-1)-YTM(y))*D/100)-1)
NAV(end)=NAV(start)*(1+YTM(y)/100)
NAV(start)=NAV(end, y-1)*(1+dNAV/100)
In this example, the NAV at the start of the year takes between 10 and 11 years to recover to what it would have been without the step.
Using this approach, we can model more gradual changes, e.g., the effect of the relatively sudden rate rises we have seen over the past couple of years and potential drops in future
Here, I've taken the yields for 10 year nominal bonds for July 2018 to July 2022 for years 0-3 and YTM for VGOV in year 4 (July 2023). I've then postulated another 0.5 percentage point increase in yields over the next year, followed by a gradual reduction to 2.5%.
A drop of over 30% in NAV can be seen followed by a gradual partial recovery (the NAV recovers to what it would have been with a 0.7% YTM after 13 years with an annualised nominal return of about 1% after 14 years)
Note: I've ignored
a) Fees (which with VGOV are small at 0.07%)
b) And that modified duration will change as the yields change (it gets smaller as yields increase)
c) Accumulation, withdrawals, and rebalancing
2 -
Which of the following are your calcs for?OldScientist said:Faffing around with a bond fund simulator is all very well (this is one of my retirement hobbies - I have an exciting life!), but there is a slightly easier way of calculating the effects of changes in bond yields on bond fund prices. You need two pieces of information
a) yield to maturity or YTM (this is not the same as yield which is backward looking). Morningstar generally has this information for bond funds
b) Modified duration (this is not the same as effective duration, although it is close enough to use either, but both are less than maturity) - the units of this are %(price change) per %(yield rate change).
For example, Vanguard U.K. Gilt UCITS ETF (VGOV) at end of July 2023 had a YTM of 4.5% and a modified duration of 9.91. The latter means that if the yield changes by 1%, the NAV will change by 9.91% in the opposite direction (i.e. increases in yields lead to decreases in NAV and vice versa).
Knowing these allows a 'simple' spreadsheet calculation. For example, with constant YTM (using the YTM for VGOV) we get the following
After the first value (i.e. year=0), NAV is (1+YTM(y)/100)*NAV(y-1)
For a single step change in interest rates (assumed to take place at the beginning of a year) we get the following
Where, dNAV is 100*((1+(YTM(y-1)-YTM(y))*D/100)-1)
NAV(end)=NAV(start)*(1+YTM(y)/100)
NAV(start)=NAV(end, y-1)*(1+dNAV/100)
In this example, the NAV at the start of the year takes between 10 and 11 years to recover to what it would have been without the step.
Using this approach, we can model more gradual changes, e.g., the effect of the relatively sudden rate rises we have seen over the past couple of years and potential drops in future
Here, I've taken the yields for 10 year nominal bonds for July 2018 to July 2022 for years 0-3 and YTM for VGOV in year 4 (July 2023). I've then postulated another 0.5 percentage point increase in yields over the next year, followed by a gradual reduction to 2.5%.
A drop of over 30% in NAV can be seen followed by a gradual partial recovery (the NAV recovers to what it would have been with a 0.7% YTM after 13 years with an annualised nominal return of about 1% after 14 years)
Note: I've ignored
a) Fees (which with VGOV are small at 0.07%)
b) And that modified duration will change as the yields change (it gets smaller as yields increase)
c) Accumulation, withdrawals, and rebalancing
a) You hold the bonds with initial duration X until maturity
b) You hold a bond fund with constant duration X (fund manager rebalances)
Hope the question makes sense?I think....0 -
At one level it should not make a major difference in that, all other things being equal and constant, different bonds will price themselves so that they all broadly provide the same return for any given time frame. If they did not you could make more money by say buying a 1 year bond and then a 4 year bond or buying a 20 year bond and selling after 5 years rather than buying a 5 year bond.michaels said:
Which of the following are your calcs for?OldScientist said:Faffing around with a bond fund simulator is all very well (this is one of my retirement hobbies - I have an exciting life!), but there is a slightly easier way of calculating the effects of changes in bond yields on bond fund prices. You need two pieces of information
a) yield to maturity or YTM (this is not the same as yield which is backward looking). Morningstar generally has this information for bond funds
b) Modified duration (this is not the same as effective duration, although it is close enough to use either, but both are less than maturity) - the units of this are %(price change) per %(yield rate change).
For example, Vanguard U.K. Gilt UCITS ETF (VGOV) at end of July 2023 had a YTM of 4.5% and a modified duration of 9.91. The latter means that if the yield changes by 1%, the NAV will change by 9.91% in the opposite direction (i.e. increases in yields lead to decreases in NAV and vice versa).
Knowing these allows a 'simple' spreadsheet calculation. For example, with constant YTM (using the YTM for VGOV) we get the following
After the first value (i.e. year=0), NAV is (1+YTM(y)/100)*NAV(y-1)
For a single step change in interest rates (assumed to take place at the beginning of a year) we get the following
Where, dNAV is 100*((1+(YTM(y-1)-YTM(y))*D/100)-1)
NAV(end)=NAV(start)*(1+YTM(y)/100)
NAV(start)=NAV(end, y-1)*(1+dNAV/100)
In this example, the NAV at the start of the year takes between 10 and 11 years to recover to what it would have been without the step.
Using this approach, we can model more gradual changes, e.g., the effect of the relatively sudden rate rises we have seen over the past couple of years and potential drops in future
Here, I've taken the yields for 10 year nominal bonds for July 2018 to July 2022 for years 0-3 and YTM for VGOV in year 4 (July 2023). I've then postulated another 0.5 percentage point increase in yields over the next year, followed by a gradual reduction to 2.5%.
A drop of over 30% in NAV can be seen followed by a gradual partial recovery (the NAV recovers to what it would have been with a 0.7% YTM after 13 years with an annualised nominal return of about 1% after 14 years)
Note: I've ignored
a) Fees (which with VGOV are small at 0.07%)
b) And that modified duration will change as the yields change (it gets smaller as yields increase)
c) Accumulation, withdrawals, and rebalancing
a) You hold the bonds with initial duration X until maturity
b) You hold a bond fund with constant duration X (fund manager rebalances)
Hope the question makes sense?
The key difference is that the return from individual bonds held until maturity is guaranteed at purchase whereas a say 5 year bond fund will still be a 5 year bond fund in 5 years time and so will be subject to continual changes in return as market conditions change.1 -
In the earlier posts it was a) (although following the approach generally used by the bogleheads, the bonds were sold at 1 year to maturity* - the difference is marginal since bond prices do not change that much in the last year). * The approach allows any contiguous range of maturities to be held, e.g. buy at 10 years and sell at 5 yearsmichaels said:
Which of the following are your calcs for?OldScientist said:Faffing around with a bond fund simulator is all very well (this is one of my retirement hobbies - I have an exciting life!), but there is a slightly easier way of calculating the effects of changes in bond yields on bond fund prices. You need two pieces of information
a) yield to maturity or YTM (this is not the same as yield which is backward looking). Morningstar generally has this information for bond funds
b) Modified duration (this is not the same as effective duration, although it is close enough to use either, but both are less than maturity) - the units of this are %(price change) per %(yield rate change).
For example, Vanguard U.K. Gilt UCITS ETF (VGOV) at end of July 2023 had a YTM of 4.5% and a modified duration of 9.91. The latter means that if the yield changes by 1%, the NAV will change by 9.91% in the opposite direction (i.e. increases in yields lead to decreases in NAV and vice versa).
Knowing these allows a 'simple' spreadsheet calculation. For example, with constant YTM (using the YTM for VGOV) we get the following
After the first value (i.e. year=0), NAV is (1+YTM(y)/100)*NAV(y-1)
For a single step change in interest rates (assumed to take place at the beginning of a year) we get the following
Where, dNAV is 100*((1+(YTM(y-1)-YTM(y))*D/100)-1)
NAV(end)=NAV(start)*(1+YTM(y)/100)
NAV(start)=NAV(end, y-1)*(1+dNAV/100)
In this example, the NAV at the start of the year takes between 10 and 11 years to recover to what it would have been without the step.
Using this approach, we can model more gradual changes, e.g., the effect of the relatively sudden rate rises we have seen over the past couple of years and potential drops in future
Here, I've taken the yields for 10 year nominal bonds for July 2018 to July 2022 for years 0-3 and YTM for VGOV in year 4 (July 2023). I've then postulated another 0.5 percentage point increase in yields over the next year, followed by a gradual reduction to 2.5%.
A drop of over 30% in NAV can be seen followed by a gradual partial recovery (the NAV recovers to what it would have been with a 0.7% YTM after 13 years with an annualised nominal return of about 1% after 14 years)
Note: I've ignored
a) Fees (which with VGOV are small at 0.07%)
b) And that modified duration will change as the yields change (it gets smaller as yields increase)
c) Accumulation, withdrawals, and rebalancing
a) You hold the bonds with initial duration X until maturity
b) You hold a bond fund with constant duration X (fund manager rebalances)
Hope the question makes sense?
In the post quoted here, it was b)+ - I know the YTM for VGOV in July 2023 = 'Year 4', but have assumed that it was roughly equal to the 10 year bond yield to get earlier values (Years 0 to 3). A few 10s of basis points around these values doesn't make that much difference to the behaviour (even if the numbers change a bit). Clearly future values are unknown, so my guess after Year 4 is purely indicative and not predictive (although the point is that if, and that is a big if, yields go back down, bond funds will eventually recover at least in nominal terms). + I note that the modified duration is assumed to be constant which implies that the weighted maturity would have to be changed, in reality, the maturity/duration of VGOV would depend on gilt issues by the UK government and their relative free float values, so the effective and modified durations would change.
* and + : edited for clarity0 -
Just to finish off the analysis, I've now returned to the original scenarios (see first three posts) with 3 different bond funds - long (30-1, i.e., buy at a maturity of 30 years and sell at 1 year), intermediate (15-1) and short (5-1). As each maturing bond is sold, the proceeds together with the coupons from all of the bonds held are used to purchase the bond with the longest maturity (see https://www.bogleheads.org/forum/viewtopic.php?t=179425&sid=ad6185a3f51c89f8778143ac0c83b837 for details).
The effect on the weighted duration of the fund of a step increase in yields applied after 5 years is illustrated in the following graph.
As can be seen, the increase in interest rates reduces the weighted duration of the fund by a larger amount for longer duration funds (e.g. the duration of the long fund drops from 14.7 to about 12 years, the intermediate fund from 8 to about 7.2 years, and the short fund from 3.2 to 3.1 years).
This arises because of two reasons:
1) the value of the longest maturity bonds in the fund drops more than that for the shortest bonds (since the weighted maturity is weighted by value, then this also drops)
2) the duration of the longest maturity bonds in the fund drop more than the duration of the shortest maturity bonds (e.g., the duration of the bonds with 30 year maturity drop from 28.6 years before the increase in yields to 23.4 years afterwards).
While the holding mechanism in an index fund (like VGOV) is not exactly the same as modelled (since new issues of whatever maturity will result in the portfolio being updated), the behaviour will be close enough.
2 -
There's a few questions here:coastline said:A real world fund with a duration of around 10-14 years ( not sure but near ? ) . UK ETF VGOV. If you were unlucky and bought the fund at 2600p then today at 1600p it needs to rise 60% to break even. The nominal yield was always there or not ? I'm not talking (YTR) Yield To Redemption. So where do we get 60% looking at the list below up to 10-15years . Many of those prices are in the £90's today and mature at £100 . I might have it wrong but is the fund price from 2014 to 2021 a blip ? 10 year bond yield was 3% and down under 1% by 2020.
UK Gilt Prices and Yields (dividenddata.co.uk)
VGOV stood at 2000-2200p around 2014 . Realistically ( could be wrong ) I think this will be the region but could be years away ( more like an equity crash recovery.) If there's an economic slump rates will probably be cut so there's some up lift to be had. Set the chart to10 years and UK 10yr bond yield was 3% in 2014 and similar last year . Now yield is 4.5% and in that short time (2022-2023) VGOV has moved from 1600 up to 1800 and back down again. It's not moving a great deal every 1% move in the bond yield.
United Kingdom Government Bond 10Y - 2023 Data - 1980-2022 Historical - 2024 Forecast (tradingeconomics.com)
Vanguard UK Gilt UCITS ETF, UK:VGOV Advanced Chart - (LON) UK:VGOV, Vanguard UK Gilt UCITS ETF Stock Price - BigCharts.com (marketwatch.com)
Yes I understand buying single gilt/bond today and locking in for 4.5% -5% YTR but I can't figure it in a real world fund. Another thing bonds/gilts in a fund will be replaced at maturity . All subject to volatility and events in the future. So that VGOV at 2600p will it happen in a decade ? I can see 2200p ? But what about when gilts stood at a big premium to £100.? Looking at the moves below there's going to be a fair bit of volatility. As I've said there's going to be 1% -2% moves in bond yields in a short space of time. Pretty normal really.
TR30 stood at £150 a few years ago..
Treasury 4.75% 07/12/2030 Share Price (TR30) Gilt | TR30 (hl.co.uk)
FsZwd6qXwAImInR (900×561) (twimg.com)
I note that VGOV is distributing, so the price is capital only, coupons (less fees) are paid out - the accumulating version of Vanguard U.K. Government Bond Index Fund (IE00B1S75374) may be a better comparison (which also currently has a duration of just under 10 years).
Over 10 years that fund has had a total return of close to zero (-0.07%). Yields 10 years ago were 3.0% and are currently about 4.5% so purely on price, a loss of roughly 45% would have been expected. However, 10 years worth of coupons have also been paid out which have mitigated that loss. Assuming the duration was constant at 9.9 years, and taking the yields in each September, we'd get
The annualised return to the September 2023 was about -0.7%, which given the crudeness of the calculation (e.g., I've no idea what the duration of that fund was in the years from 2013 to 2022) isn't too far from the actual -0.1%. The simulated NAV, has the same behaviour as actual fund NAV (taken from the chart at morningstar (https://www.morningstar.co.uk/uk/funds/snapshot/snapshot.aspx?id=F000003VEE ) although the actual numbers are not identical. Obvious, what happens next is unknown, so my YTM for the next few years are merely guesses (and not predictions).
The 60% to break even comes from the yield to maturity (or redemption) which includes both capital gains and reinvested coupons.
You're right that internal workings of a bond fund are not trivial to understand. It is worth downloading the bogleheads bond fund simulator ( Historical Bond Returns - From Rates to Returns [Bond Fund Simulator] ) just to see how historical changes in yields affected funds made up of different bond maturities (albeit the simulator only contains US data).
You're right about volatility - the standard 'advice' is that bond funds are there to reduce risk (aka volatility) in a portfolio, but if anything the recent events have provided a lesson that not all bonds funds do that equally - with volatility being critically dependent on the duration. This is why a lot of the US retirement literature (including Bengen in the original SWR paper) uses intermediate duration bonds (duration~5 years) since this represents a compromise between typically larger returns than very short durations (bills/cash), but without the volatility of longer durations.
Rather off topic, but some of us are perverse and include funds with large volatility (e.g. Vanguard Inflation linked gilt fund, which currently has a duration of nearly 17 years!) since they can provide rebalancing opportunities and potentially reduce the overall portfolio volatility.
2


Confirm your email address to Create Threads and Reply

Categories
- All Categories
- 354.6K Banking & Borrowing
- 254.5K Reduce Debt & Boost Income
- 455.5K Spending & Discounts
- 247.5K Work, Benefits & Business
- 604.4K Mortgages, Homes & Bills
- 178.6K Life & Family
- 262K Travel & Transport
- 1.5M Hobbies & Leisure
- 16.1K Discuss & Feedback
- 37.7K Read-Only Boards