We’d like to remind Forumites to please avoid political debate on the Forum.
This is to keep it a safe and useful space for MoneySaving discussions. Threads that are – or become – political in nature may be removed in line with the Forum’s rules. Thank you for your understanding.
📨 Have you signed up to the Forum's new Email Digest yet? Get a selection of trending threads sent straight to your inbox daily, weekly or monthly!
The Forum now has a brand new text editor, adding a bunch of handy features to use when creating posts. Read more in our how-to guide
Octopus Tracker - Electricity Prices Nov/Dec 2022


Hi,
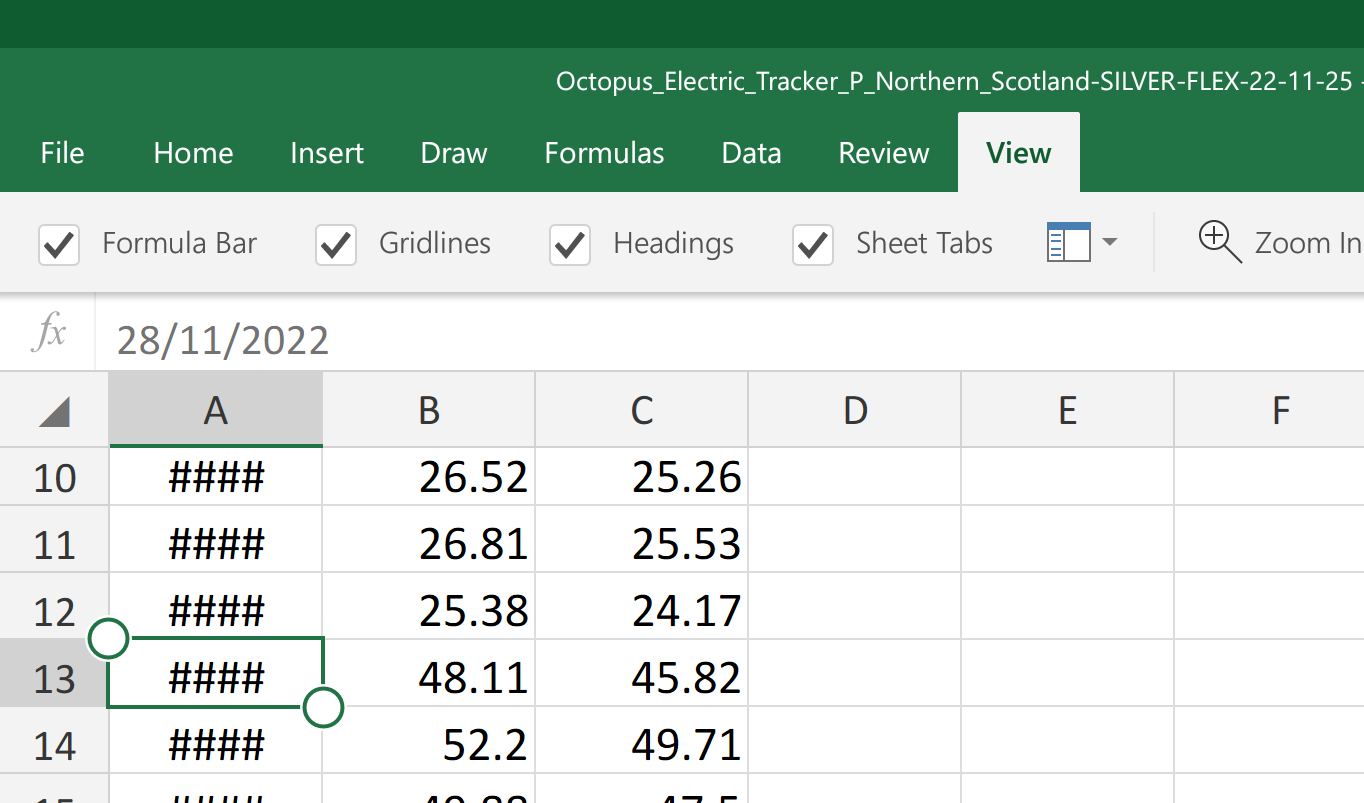
I'm looking back at last Autumn prices, from before I was on the tariff. As I understand it Octopus was applying the EPG discount on days that Tracker rose above that.
I found these historical figures, but can anyone tell me whether these were the raw figure, before EPG discount, or the prices actually paid? I would have expected to see a plateau at the EPG which at that time was just over 33p. However I guess it's possible that the rate jumped so far between between 27th and 28th that the price shown is after the 17p discount.
0
Comments
-
Try this site
https://energy-stats.uk/octopus-tracker-west-midlands/
Just change it to your region. It goes back one year. I would caution against drawing any conclusions from the last few years figures. They are all over the place and are unlikely to reflect future prices.
DarrenXbigman's guide to a happy life.
Eat properly
Sleep properly
Save some money0 -
I think Xbigman is correct, and those are the uncapped prices (before EPG and before the internal Tracker cap, which ran at various levels depending on Tracker version).Xbigman said:
N. Hampshire, he/him. Octopus Intelligent Go elec & Tracker gas / Vodafone BB / iD mobile. Kirk Hill Co-op member.Ofgem cap table, Ofgem cap explainer. Economy 7 cap explainer. Gas vs E7 vs peak elec heating costs, Best kettle!
2.72kWp PV facing SSW installed Jan 2012. 11 x 247w panels, 3.6kw inverter. 35 MWh generated, long-term average 2.6 Os.0


Confirm your email address to Create Threads and Reply

Categories
- All Categories
- 354.3K Banking & Borrowing
- 254.4K Reduce Debt & Boost Income
- 455.4K Spending & Discounts
- 247.3K Work, Benefits & Business
- 604K Mortgages, Homes & Bills
- 178.4K Life & Family
- 261.5K Travel & Transport
- 1.5M Hobbies & Leisure
- 16K Discuss & Feedback
- 37.7K Read-Only Boards