We’d like to remind Forumites to please avoid political debate on the Forum.
This is to keep it a safe and useful space for MoneySaving discussions. Threads that are – or become – political in nature may be removed in line with the Forum’s rules. Thank you for your understanding.
📨 Have you signed up to the Forum's new Email Digest yet? Get a selection of trending threads sent straight to your inbox daily, weekly or monthly!
The Forum now has a brand new text editor, adding a bunch of handy features to use when creating posts. Read more in our how-to guide
Private Pension Lifestyling investments - the next scandal?
Comments
-
I suspect very few people would stay the course in a high equity allocation portfolio when seeing their main (possible only) income source drop by 75% and then staying relatively flat for the next 10 yrs.
The 50/50 portfolio is still scary though.
0 -
With regards to your flexible drawdown 'postage stamps' isn't the point of such an approach to see how far one might be able to increase the initial withdrawal rate above the SWR before too many of the outcomes see income fall below an acceptable level?OldScientist said:
The questions are thenPat38493 said:
I think in reality it depends what you mean by holding nerve. In that scenario which seems to be a known outlier if you plot lots of years on the same chart, I would most likely reduce spending but I would not change my investment mix and sell at the bottom.michaels said:
This is another problem I have with swr - a lot of the scenarios that turn out to be safe see withdrawals reaching >20% of the portfolio (portfolio only covers 5 years of withdrawals) within the first decade. Who on earth is going to hold their nerve in such a scenario?
I suspect if you plot the same graphs over 40 or 45 years for an early retiree the equity one will catch up and overtake the 50/50 chart which might fail with much longer horizon.
In any case even if you foresaw 1973 and moved into cash at the top, you would then have got walloped by inflation later in the 1970s.
The prior proposal was to use a glide path increasing from 60% equity to 100% during approximately the first decade. You can’t really avoid seeing a terrifying early drop in some of those outlier scenarios. The simulations showed that this provided a slightly better outcome in most situations than any of the fixed balanced allocations.
In a way that’s the easy one. More worrying is the ones like I think around 1963 or so where it looks like you are doing great for 7-8 years and then…..
However I take the point that in the real world there are certainly situations when most of us would reduce spending to be on the safe side even if the data says it should be ok.
a) When would you reduce spending?
b) By how much?
The following graphs are the real withdrawal as a function of time since retirement for various percentiles (0th is worst case, 50% is median) for a UK 50/25/25 allocation (stocks/bonds/cash). The different panels are how much year-to-year flexibility in the real withdrawal is allowed using the Vanguard Dynamic approach (e.g., see https://www.vanguard.ca/documents/literature/dynamic-ret-spending-paper.pdf for details). For example, in the panel marked '2' this means that the real withdrawal is allowed to vary by up 2% per year.
The top left panel (marked 0) is the constant pound (i.e., SWR) approach - the income fell to zero in just under 5% of historical retirements after 30 years, and somewhere between 10% and 25% after 40 years. The bottom right panel (marked '100') is withdrawals using a constant percentage of portfolio (i.e., in this case, 3% of whatever the portfolio value is at the time) - while the income never fell to zero, it did become very small after 40 years (1% in worst case and about 2.7% in the median case). The other panels represent cases between these two extremes.
The two extremes have opposite advantages and disadvantages:
1) For SWR approach, the income is constant in real terms (advantage) until it fails (disadvantage).
2) For percentage portfolio, the income never fell to zero (advantage) but it did fall to less than 1% in the worst cases after 40 years (disadvantage).
Which is best for a given retiree is dependent on their circumstances. For example,
1) A retiree whose expenditure is largely covered by sources of guaranteed income (state pension, DB pension, annuities, inflation linked ladders) may be be happier with more income variation (so could choose a higher flexibility number)
2) A retiree whose sources of guarantee income fall well below their required expenditure, might be happier with a lower flexibility number.
1969 is a problematic retirement (see the plot of SWR vs time in earlier post) - using 4% withdrawals (to save space, I've cut the lower panel off).
Here is 100% stocks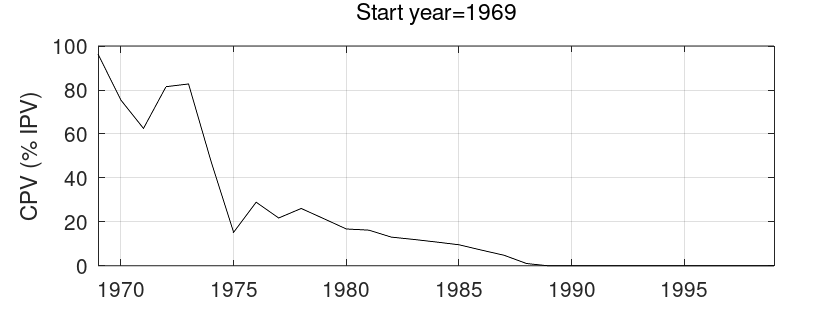
And the following is for 50% stocks (and 50% cash - note that with 100% bonds, the portfolio falls to zero in 1994).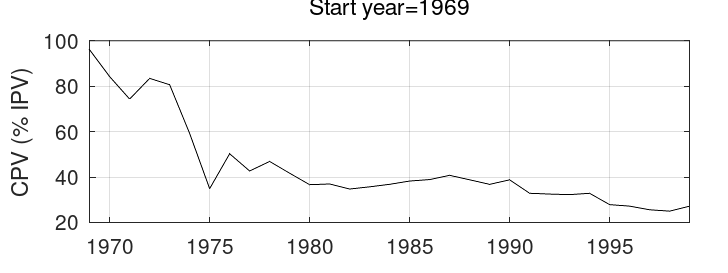
You're right - the first 5 years are plain sailing, but at some point during 1973 (and certainly by the beginning of 1974), worry would be setting in (in either case to be honest).I think....0 -
I like the term 'postage stamps'!michaels said:
With regards to your flexible drawdown 'postage stamps' isn't the point of such an approach to see how far one might be able to increase the initial withdrawal rate above the SWR before too many of the outcomes see income fall below an acceptable level?OldScientist said:
The questions are thenPat38493 said:
I think in reality it depends what you mean by holding nerve. In that scenario which seems to be a known outlier if you plot lots of years on the same chart, I would most likely reduce spending but I would not change my investment mix and sell at the bottom.michaels said:
This is another problem I have with swr - a lot of the scenarios that turn out to be safe see withdrawals reaching >20% of the portfolio (portfolio only covers 5 years of withdrawals) within the first decade. Who on earth is going to hold their nerve in such a scenario?
I suspect if you plot the same graphs over 40 or 45 years for an early retiree the equity one will catch up and overtake the 50/50 chart which might fail with much longer horizon.
In any case even if you foresaw 1973 and moved into cash at the top, you would then have got walloped by inflation later in the 1970s.
The prior proposal was to use a glide path increasing from 60% equity to 100% during approximately the first decade. You can’t really avoid seeing a terrifying early drop in some of those outlier scenarios. The simulations showed that this provided a slightly better outcome in most situations than any of the fixed balanced allocations.
In a way that’s the easy one. More worrying is the ones like I think around 1963 or so where it looks like you are doing great for 7-8 years and then…..
However I take the point that in the real world there are certainly situations when most of us would reduce spending to be on the safe side even if the data says it should be ok.
a) When would you reduce spending?
b) By how much?
The following graphs are the real withdrawal as a function of time since retirement for various percentiles (0th is worst case, 50% is median) for a UK 50/25/25 allocation (stocks/bonds/cash). The different panels are how much year-to-year flexibility in the real withdrawal is allowed using the Vanguard Dynamic approach (e.g., see https://www.vanguard.ca/documents/literature/dynamic-ret-spending-paper.pdf for details). For example, in the panel marked '2' this means that the real withdrawal is allowed to vary by up 2% per year.
The top left panel (marked 0) is the constant pound (i.e., SWR) approach - the income fell to zero in just under 5% of historical retirements after 30 years, and somewhere between 10% and 25% after 40 years. The bottom right panel (marked '100') is withdrawals using a constant percentage of portfolio (i.e., in this case, 3% of whatever the portfolio value is at the time) - while the income never fell to zero, it did become very small after 40 years (1% in worst case and about 2.7% in the median case). The other panels represent cases between these two extremes.
The two extremes have opposite advantages and disadvantages:
1) For SWR approach, the income is constant in real terms (advantage) until it fails (disadvantage).
2) For percentage portfolio, the income never fell to zero (advantage) but it did fall to less than 1% in the worst cases after 40 years (disadvantage).
Which is best for a given retiree is dependent on their circumstances. For example,
1) A retiree whose expenditure is largely covered by sources of guaranteed income (state pension, DB pension, annuities, inflation linked ladders) may be be happier with more income variation (so could choose a higher flexibility number)
2) A retiree whose sources of guarantee income fall well below their required expenditure, might be happier with a lower flexibility number.
1969 is a problematic retirement (see the plot of SWR vs time in earlier post) - using 4% withdrawals (to save space, I've cut the lower panel off).
Here is 100% stocks
And the following is for 50% stocks (and 50% cash - note that with 100% bonds, the portfolio falls to zero in 1994).
You're right - the first 5 years are plain sailing, but at some point during 1973 (and certainly by the beginning of 1974), worry would be setting in (in either case to be honest).
As for your comment, I think there are two viewpoints (IMO, equally valid):
1) As you say, increase the initial withdrawal rate such that, for example, the failure rate after 30 years is similar with the risk that future conditions may be worse than in the past.
2) Keep the same initial withdrawal rate and improve the robustness of the withdrawals against conditions that in the future may (or may not) be worse than those in the past with the risk that the income will be worse than necessary.
For example, in the first viewpoint, with flex=3% (i.e. left panel in middle row), the initial withdrawal rate could be increased to about 4% and no income failures would have occurred in the first 30 years. However, if future real returns were 1 percentage point lower than in the past, then there would have been income failures in the first 30 years in about 10% of retirements.
In the second viewpoint, with flex=3%, with the original rate of 3%, a reduction in asset returns of 1 percentage point resulted in no failures (even after 40 years), although income after 40 years fell to about 1% in about 5% of cases.
There may be other ways of introducing robustness (e.g. increasing the floor income - state pension, DB pensions, annuities, and inflation linked ladders) rather than wholly relying on the portfolio. To take an example, the payout rate for an inflation linked annuity for a couple both 65yo with 50% benefits is currently about 3.6% or so. If half the initial portfolio is used to purchase the annuity and the remaining half is set to a stock allocation of 90% stocks and 10% cash (strictly speaking it should be 100% stocks assuming an overall allocation of 50% or more) with withdrawals made using a constant percentage of portfolio strategy (constant percentage=3%) then the income (top panel) and portfolio value (bottom panel) would have been as follows:
While there is still considerably variation in the income, the floor provided by the annuity at least limited the worst case income to about 2.2% (in 75% of retirements, it never fell below the SWR of 3%). Of course, any legacy would have been halved for the first decade or more (after 30 years or more, at least there is something left in the portfolio). It is also the case that 18 months ago, an annuity would have been much less attractive.
I'm conscious that while this is interesting, we've rather hijacked the OP thread, so shall probably stop there.
2 -
Well you say that but the charges posted by Old Scientist appear to show the 100% equities still come out on top over 40 years - the green line never is below any of the others, or at least hardly ever.m_c_s said:I suspect very few people would stay the course in a high equity allocation portfolio when seeing their main (possible only) income source drop by 75% and then staying relatively flat for the next 10 yrs.
The 50/50 portfolio is still scary though.0 -
But unless you are a time traveller you would never know that.Pat38493 said:
Well you say that but the charges posted by Old Scientist appear to show the 100% equities still come out on top over 40 years - the green line never is below any of the others, or at least hardly ever.2 -
On the graph of the SWRs across all the years and for various different equity portions, the 100% equity is pretty consistently slightly above everything else. So I would know that unless I believe a worse scenario will come than anything that ever happened before (as pointed out above also by Old Scientist). If the market dropped that steeply over 2 years, I don't think it ever happened before that it then continued to plumet for a 3rd and 4th year. It could happen of course, but if that was the case I suspect we would have a lot of other issues than just having to cut spending.m_c_s said:
But unless you are a time traveller you would never know that.Pat38493 said:
Well you say that but the charges posted by Old Scientist appear to show the 100% equities still come out on top over 40 years - the green line never is below any of the others, or at least hardly ever.
0 -
Caveats as statedPat38493 said:On the graph of the SWRs across all the years and for various different equity portions, the 100% equity is pretty consistently slightly above everything else. So I would know that unless I believe a worse scenario will come than anything that ever happened before (as pointed out above also by Old Scientist). If the market dropped that steeply over 2 years, I don't think it ever happened before that it then continued to plumet for a 3rd and 4th year. It could happen of course, but if that was the case I suspect we would have a lot of other issues than just having to cut spending.OldScientist said:
A few other things to note:
1) The SWR could be highly variable from year-to-year
2) Higher stock allocations tended to result in higher SWR (mainly down to poor bond performance)
3) SWR for a given retirement was only known at the end of the 30 year period (in other words, at the start of retirement the retiree would have no real idea).0 -
For sure, which is why (for example) the minimum SWR would be the lowest level of the green bar on the graph to assume the worst case scenario. Of course if you believe your scenario will be worse (or better) than all prior years, then per definition you don't believe in safe withdrawal rates at all?m_c_s said:
Caveats as statedPat38493 said:On the graph of the SWRs across all the years and for various different equity portions, the 100% equity is pretty consistently slightly above everything else. So I would know that unless I believe a worse scenario will come than anything that ever happened before (as pointed out above also by Old Scientist). If the market dropped that steeply over 2 years, I don't think it ever happened before that it then continued to plumet for a 3rd and 4th year. It could happen of course, but if that was the case I suspect we would have a lot of other issues than just having to cut spending.OldScientist said:
A few other things to note:
1) The SWR could be highly variable from year-to-year
2) Higher stock allocations tended to result in higher SWR (mainly down to poor bond performance)
3) SWR for a given retirement was only known at the end of the 30 year period (in other words, at the start of retirement the retiree would have no real idea).
What you can also see from that chart is that at the worst possible times in history, there wasn't that much difference other than if you were all in cash/bonds - you would still see some scary looking graphs at those times and you would still have to stick or twist. We don't see the chart that shows what would have happened if you had moved from 100% or 75% stocks, to a much lower portion, right at the bottom of the market, but I doubt it would have improved your situation.
The chart also doesn't show 2000 or 2008 for obvious reasons but if you do shorter timelines that includes it, those don't look too good either.
But the other point being made was that even given this, there have been a few historic scenarios when you would have seen some scary drops in the first 10 years (albeit that the x axis on the graph didn't start at zero so it looked even worse on this thread), so if this is your only source of money in retirement you would have to have a pretty strong faith in capitlism or whatever to stick to your guns through that drop like in 1973 - the fact remains though that the scenario did pan out in the end.0 -
I believe that is because UK bonds have not worked quite as well as lets say US bonds, which gave better protection at the time it mattered for US markets. The results using global equities and global bonds could be quite different.Pat38493 said:
On the graph of the SWRs across all the years and for various different equity portions, the 100% equity is pretty consistently slightly above everything else. So I would know that unless I believe a worse scenario will come than anything that ever happened before (as pointed out above also by Old Scientist). If the market dropped that steeply over 2 years, I don't think it ever happened before that it then continued to plumet for a 3rd and 4th year. It could happen of course, but if that was the case I suspect we would have a lot of other issues than just having to cut spending.m_c_s said:
But unless you are a time traveller you would never know that.Pat38493 said:
Well you say that but the charges posted by Old Scientist appear to show the 100% equities still come out on top over 40 years - the green line never is below any of the others, or at least hardly ever.0 -
Another problem with SWR (in addition to the 'holding your nerve' ) is that it is all framed against the initial conditions at the moment of retirement. So the person that retired during one of the drops will have a much lower SW amount than their virtual twin who retire a year or so previous at a market peak. This implies that the same pot at year zero with the same investment strategy will provide one level of retirement if taken in year zero with the market high and a second much lower level if taken in year 2 after a market crash - even though the person who retired in year zero will have suffered the same investment fall as the person who retires in year 2.
(An alternative way of looking at this is that if the person who retired in year zero returns to work for 1 day in year 2 and then re-retires, suddenly the pot that would previously have given them the year zero SWR will now only give the much lower year 2 SVR)I think....1


Confirm your email address to Create Threads and Reply

Categories
- All Categories
- 354.6K Banking & Borrowing
- 254.5K Reduce Debt & Boost Income
- 455.5K Spending & Discounts
- 247.5K Work, Benefits & Business
- 604.4K Mortgages, Homes & Bills
- 178.6K Life & Family
- 261.9K Travel & Transport
- 1.5M Hobbies & Leisure
- 16.1K Discuss & Feedback
- 37.7K Read-Only Boards