We’d like to remind Forumites to please avoid political debate on the Forum.
This is to keep it a safe and useful space for MoneySaving discussions. Threads that are – or become – political in nature may be removed in line with the Forum’s rules. Thank you for your understanding.
📨 Have you signed up to the Forum's new Email Digest yet? Get a selection of trending threads sent straight to your inbox daily, weekly or monthly!
The Forum now has a brand new text editor, adding a bunch of handy features to use when creating posts. Read more in our how-to guide
Sort/Filter

Robm1955
Posts: 553 Forumite


in Techie Stuff
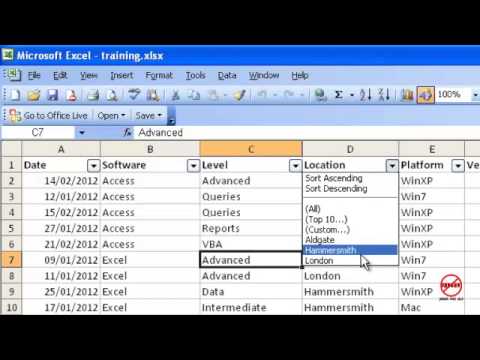
For our club, I have created a Bonus Ball Bingo table, which consists of 4 columns, name, and their chosen numbers 1,2,3, and 4. As an example, one person might pick No.7 as their first ball, another might have No.7 as their third choice. So these would be in columns 1, and 3. What I want to do , is to filter or sort the spreadsheet to show me the names, and all ocurrences of No 7, or whatever number I choose. Does anyone how I can do this? I'm using Excel 2003 (I prefer it)
0
Comments
-
Rather than what you have as your subject title by far the better and more flexible way is to have all your bingo table ad the source data for a pivot table.That enables you to sort select filter count sum to your hearts content.Simply select the cells with their headings (or pick if already a named range - to be recommended!) and use the menu system to make a pivot table. Possibly best to have that PT on a separate sheet.If I doubt have a look online how to do it.If you use spreadsheets a.lite learning about PTs is well worth the effort!!Although better, like everything there is a downside. You can select options to refresh (update data) the PT data analysis when the spread sheet file opens but if changes made to data once opened you Simply have to ask for refresh in the PT menu. That can be automated but not really worth it for your need. You can even populate you bingo table with the current date and use that in the PT to indicate the latest update date/time.Do post or get in touch if you need more help.0
-
Never done a pivot table, so totally confused. The headings are Name, Ball 1, Ball 2, Ball 3, and Ball 4.0
-
As advised use a pivot table, but if you want to use a filterI'm using libre office, which is a clone of excel 20031) jab the top left corner to select all the data (or run the selector over it all) you might not need to, you don't in libreoffice2) open data menu select standard filter, then pick what you want. Subsequent rows from the first can be ANDed or OR'dWhen I click OK only the titles and row d remain

I want to go back to The Olden Days, when every single thing that I can think of was better.....
(except air quality and Medical Science") )0
)0 -
Very similar in Excel.Loads on the net to tell you how but here is one example https://www.excelarticles.com/excelbook/how_to_sort_data.html for the built in sort.A bit more complicated initially but quite a comprehensive how to do a pivot table at https://www.excelarticles.com/excelbook/use_a_pivot_table_to_summarize_detailed_data.htmlMake your choice and give it a go!
0 -
Thanks Facade, but there's no standard filter in 2003. My filter is a little different to yours. As you can see from the screenshot below, the number 11 appears a few times. It could even be in the column Ball 4. I want to filter every name where number 11 appears, which in this case would be A,B,I, and J.facade said:As advised use a pivot table, but if you want to use a filterI'm using libre office, which is a clone of excel 20031) jab the top left corner to select all the data (or run the selector over it all) you might not need to, you don't in libreoffice2) open data menu select standard filter, then pick what you want. Subsequent rows from the first can be ANDed or OR'dWhen I click OK only the titles and row d remain
When trying to do a pivot table, gives me totals, which I don't want.
 0
0 -
You could possibly do it with an IF formula.
In the top row of the next column along (ie F2 in the example above), type:
=IF(countif(b2:e2,11),"Win","Lose")
Drag the formula down all the other rows.
This will display Win in all the rows where 11 occurs and Lose in all the rows where it doesn't. You would have to replace 11 with whatever your bonus number was each time (replace it in cell F2 and drag it down the list).
It's a bit fiddly, but it'll do what you want.
0 -
To add, that works on my spreadsheet (copy of yours) and you could add further conditional formatting to make the winning cells stand out more if you wish (fill the cells in green, for instance)1
-
The easiest solution is rather than having 4 columns for balls with each cell containing a value instead to have columns for each of the balls and then just put an X in the columns for the 4 balls they want. You then simply can filter column 7 for X (or non-blanks)
There are plenty of other options but it really does depend on how you want to operate the thing0 -
Thanks The_Unready. Did exactly what you said, and it works. Took things a bit further by doing a filter on the Win/Lose column, highlighted the winning numbers to get this. Makes it easier for the person marking them off in the club so they just have to look for the winning names, and don't have to search for every occurence of 46.

1 -
Here is how to do it with a filter like you wanted originally.Just shows how advanced Libreoffice is.Be careful with sorts though, I'm sure it only works on the column unless you highlight an area
I want to go back to The Olden Days, when every single thing that I can think of was better.....
(except air quality and Medical Science)1


 https://www.youtube.com/watch?v=7RTHPCvUzFk
Confirm your email address to Create Threads and Reply

Categories
- All Categories
- 353.5K Banking & Borrowing
- 254.1K Reduce Debt & Boost Income
- 455K Spending & Discounts
- 246.6K Work, Benefits & Business
- 602.9K Mortgages, Homes & Bills
- 178K Life & Family
- 260.5K Travel & Transport
- 1.5M Hobbies & Leisure
- 16K Discuss & Feedback
- 37.7K Read-Only Boards