We’d like to remind Forumites to please avoid political debate on the Forum.
This is to keep it a safe and useful space for MoneySaving discussions. Threads that are – or become – political in nature may be removed in line with the Forum’s rules. Thank you for your understanding.
📨 Have you signed up to the Forum's new Email Digest yet? Get a selection of trending threads sent straight to your inbox daily, weekly or monthly!
The Forum now has a brand new text editor, adding a bunch of handy features to use when creating posts. Read more in our how-to guide
USS pension: is 1/85 accrual rate + 3x lump sump DB pension any good?
Comments
-
The changes to USS over the last 10 years going from 1/80th, final salary, fully index-linked to 1/85th, career average salary, inflation capped (currently 5%, soon to be 2.5%) coupled with an increase in contributions (both employee and employer) has caused many to question the value of the pension compared to alternatives - the type of calculations considered here are one facet of that questioning. A 2.5% cap severely limits the usefulness of the pension. For example, in the following graph, the real income expressed as a fraction of the initial income at various percentiles (1st, 25th, median, etc.) as a function of time since retirement is plotted for (upper panel) a 5% cap and (lower panel) a 2.5% cap using historical UK CPI (1871 to 2016 drawn from macrohistory data base). After 35 years (a reasonable duration for a 65 year old with roughly 10% chance of reaching 100 and 20% for at least one member of a couple) the median income was 75% and 55% for the two caps, while the 1st percentile (retirements starting in the 1970s) left an income of about 40% and just under 25% in real terms. Even worse, for the bad cases, the bulk of the decline, where roughly half the real income was lost, occurred in the first decade after retirement.mark5 said:
I would quite happily swap my dc pension with 3% employers contribution for your 1/85 plus x3 lump sum and widows pension.thegentleway said:
@hyubh I wonder if you'd be so kind as to clarify: are you saying my assumption of 5% growth is unlikely? I thought this was rather conservative since on average the stock market has returned 7% per year when accounting for inflation. You only need 2.74% growth to beat DB pension at 45 years from retirement...hyubh said:There's some maths in this very thread that suggests you'd be likely to do better with your own 10% contributions and damn the 20% your employer is throwing down.Hardly likely...Yes you don’t have the best db pension out there but you do have a better pension than the majority of the UK.Contribute to a defined contribution pension alongside your existing pension and see what it returns you in the future!

The other change in the last decade has been to go from a entirely DB scheme to a hybrid DB/DC scheme - the amount in the DB is capped (to be honest at a fairly high level, I only exceeded it just before I retired) with the excess going into what is actually a good DC scheme (limited, but adequate, selection of funds and very low costs).
3 -
Indeed, and the inflation cap does not just impact upon the retirement period. A CARE scheme is revalued annually by inflation and a 2.5% cap can be equally damaging in devaluing previous accruals over a 40 year career for a 25 year old just entering the profession now before they even reach retirement, in addition to the potential 35 year retirement period you highlight above.OldScientist said:
The changes to USS over the last 10 years going from 1/80th, final salary, fully index-linked to 1/85th, career average salary, inflation capped (currently 5%, soon to be 2.5%) coupled with an increase in contributions (both employee and employer) has caused many to question the value of the pension compared to alternatives - the type of calculations considered here are one facet of that questioning. A 2.5% cap severely limits the usefulness of the pension. For example, in the following graph, the real income expressed as a fraction of the initial income at various percentiles (1st, 25th, median, etc.) as a function of time since retirement is plotted for (upper panel) a 5% cap and (lower panel) a 2.5% cap using historical UK CPI (1871 to 2016 drawn from macrohistory data base). After 35 years (a reasonable duration for a 65 year old with roughly 10% chance of reaching 100 and 20% for at least one member of a couple) the median income was 75% and 55% for the two caps, while the 1st percentile (retirements starting in the 1970s) left an income of about 40% and just under 25% in real terms. Even worse, for the bad cases, the bulk of the decline, where roughly half the real income was lost, occurred in the first decade after retirement.mark5 said:
I would quite happily swap my dc pension with 3% employers contribution for your 1/85 plus x3 lump sum and widows pension.thegentleway said:
@hyubh I wonder if you'd be so kind as to clarify: are you saying my assumption of 5% growth is unlikely? I thought this was rather conservative since on average the stock market has returned 7% per year when accounting for inflation. You only need 2.74% growth to beat DB pension at 45 years from retirement...hyubh said:There's some maths in this very thread that suggests you'd be likely to do better with your own 10% contributions and damn the 20% your employer is throwing down.Hardly likely...Yes you don’t have the best db pension out there but you do have a better pension than the majority of the UK.Contribute to a defined contribution pension alongside your existing pension and see what it returns you in the future!
The other change in the last decade has been to go from a entirely DB scheme to a hybrid DB/DC scheme - the amount in the DB is capped (to be honest at a fairly high level, I only exceeded it just before I retired) with the excess going into what is actually a good DC scheme (limited, but adequate, selection of funds and very low costs).
I would not want to have a significant portion of my pension provision capped at 2.5% over the long term. This may have seemed benign last decade when inflation was low following the 2008 GFC crash, but that was not a normal period in history and the effects are now beginning to unwind. A 2.5% cap is slowly going to erode the value of the pension over time.
I am a Forum Ambassador and I support the Forum Team on the Benefits & tax credits, Heat pumps and Green & Ethical MoneySaving forums. If you need any help on those boards, do let me know. Please note that Ambassadors are not moderators. Any post you spot in breach of the Forum Rules should be reported via the report button, or by emailing forumteam@moneysavingexpert.com. All views are my own & not the official line of Money Saving Expert.2 -
Just for interest, here are a few more calculations comparing the DB component of USS with a DC pension.
Assuming a 40 year career, with a salary that goes up with inflation, a 1/85th accrual rate, and no inflation cap (or inflation is always below the cap), then after 40 years, the DB pension would payout 40/85=0.47 real salary units (RSU) and a lump sum of 1.41 RSU.
For a DC pension, assuming a contribution rate of 10%, and a real growth rate of 0% (I'll try some other values in a minute) then the final pot would be 0.1*40=4 RSU. A joint annuity (50% survivor benefits, no guarantee) RPI linked with a 5% cap was (yesterday) 3.62% with a fully indexed (no cap) version at 3.52%, so assuming 3.5% annuity rate and leaving aside a lump sum the same as for the DB pension, this would give an income of (4-1.41)*0.035=0.09 RSU.
For a weak growth of 2% (again assuming 10% contributions), the pot would be 0.1*(1.02^39+1.02^38 ... 1.02^0)=6.04 and the income 0.16 RSU, i.e. (6.04-1.41)*0.035.
The following graph shows the DC pension income (in RSU) as a function of contribution rate for growth rates of 0% to 5%. The dashed line represents the DB pension income (remember this is uncapped). For 5% growth rate a contribution of at least 12% of salary is required to exceed the DB pension income, for 4% growth it is just over 15%, etc.
A few caveats:
1) The DB pension is uncapped for inflation, and therefore represents a maximum.
2) Worst case historical growth rate for UK stocks and bonds over 40 year period is about 1.5% real, median is about 5% real (although this depends on asset allocation - someone willing to use 100% stocks during most of the accumulation period would have done better than someone who stuck to 60% stocks). Future real growth rates are not known.
3) The annuity rate of 3.5% is not guaranteed (e.g., a year or so ago, rates would have been 2.5% and the DC income reduced by about 30%).
4) A salary growth with inflation (i.e. constant in real terms) was assumed, different salary profiles (e.g., more rapid increases in real salary in early career, followed by more stable values later on) would give different results. Reductions in real salary with time would also lead to a different result.
I was surprised that the annuity rates for the RPI and RPI capped to 5% annuities were so close (moneyhelper doesn't provide a quote for a 2.5% capped annuity) and am not entirely sure how they are priced (presumably the actuaries estimate the likely fall in real income due to the cap, with time). Given the rates are currently so close to each other, buying an annuity with the cap would, IMO, seem to be unwise.
2 -
Here are a few more results. Salary increases with inflation, so same DB pension as before (with no cap). Instead of using constant growth values, I've used historical return rates (https://www.macrohistory.net/ ) to calculate the value of the accumulated DC pot after 40 years (I've used 100% stocks for the first 34 years, and then decreased the stock allocation by 10 percentage points over the last 6 years, reaching an allocation of 40% stocks and 60% bonds at the end of the accumulation period). With that data set, that gives 108 historical accumulation examples (each of 40 years) with the last one beginning in 1979. Historical UK CPI (https://www.macrohistory.net/ ) has been used to calculate the effect of the cap over each 40 year period.
In the following graph, the fraction of historical examples where the income from the DC pension exceeded that of the DB pension, P(DC>DB) as a function of contribution rate (expressed as a % of salary) for no inflation cap, and inflation caps of 10%, 5%, and 2.5% with an annuity rate of 3.5%. Pleasingly, with no cap, P was 50% when the contribution rate was about 12%, similar to the median growth rate of 5% in the simple model (previous post). The effect of the cap was fairly clear, for a 2.5% cap, a contribution rate of about 8% (i.e. the statutory minimum) meant that the income of the DC pension exceeded that of the DB pension in about 50% of historical cases.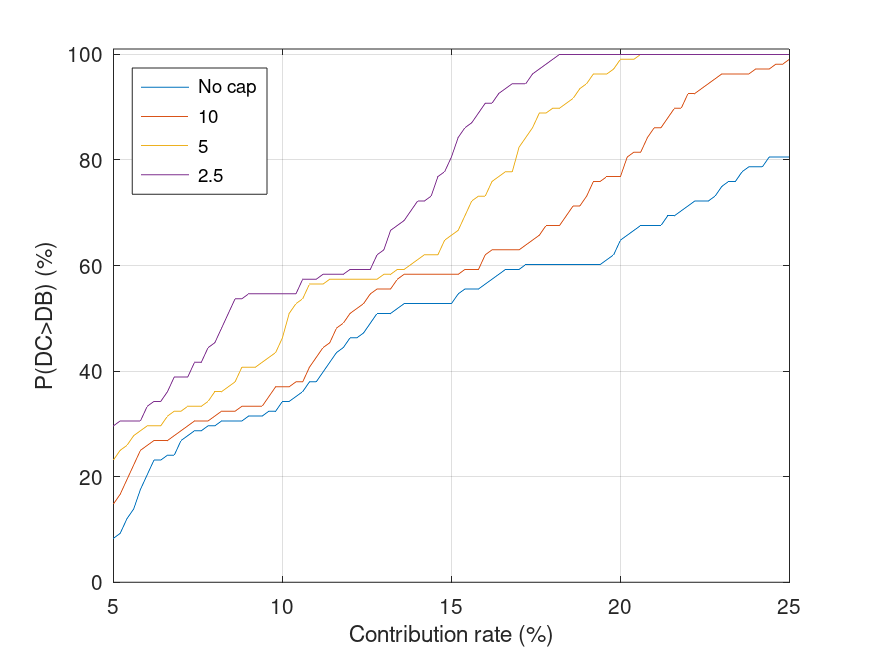
Caveats:
1) This is definitely not advice! For example, future asset returns may be significantly worse than those seen historically.
2) Salary growth with inflation was assumed. Different assumptions will lead to different outcomes.
3) An annuity rate of 3.5% was assumed - this is not guaranteed (a lower annuity rate will lead to lower values of P).
4) Tax has not been considered (e.g. tax relief on DC contributions) and fees have been ignored (which, at least nowadays, are likely to be a relatively small drag).
2 -
OldScientist said:the amount in the DB is capped (to be honest at a fairly high level, I only exceeded it just before I retired) with the excess going into what is actually a good DC scheme (limited, but adequate, selection of funds and very low costs).Just wanted to pick up one point here, but I have to say thank you so much for bringing the whiteboard into the room, so to speak - those graphs you presented are such a helpful way of understanding the range of possible outcomes against a historical backdrop.The main thing I'd disagree with is that the salary cap on the DB portion of the scheme is set at a high level - it was set at a high level when it was introduced (55000 in 2015).It was dropped to 40,000 as of 2022.That's only just over half the original 2015 cap, in real terms (55000 2015 pounds is worth nearly 70000 now).Average full time salary in the UK is 33,000, and USS is only open to staff in professional roles, most of whom should be in a position to aspire to more than 1/5th over the average salary.1
-
Thanks for that correction - I retired in 2019 and haven't kept up with everything going on in USS on the accrual side of things, so didn't notice that change. With a 2.5% inflation cap on the DB part, the DC component might provide more pension income for those at the beginning of their career at a university that uses USS (as mentioned upthread, those universities using the Teacher Pension have a huge advantage), so the reduction in salary cap may not now be such a bad thing as it would have been when it was a fully index linked pension. There is no doubt that the product is now considerably inferior to what it was only a decade ago and, it would appear, on a median 'historical probability' basis is coming close to being inferior to a DC pension. Whatever gold plating it once had has largely been scratched off!Universidad said:OldScientist said:the amount in the DB is capped (to be honest at a fairly high level, I only exceeded it just before I retired) with the excess going into what is actually a good DC scheme (limited, but adequate, selection of funds and very low costs).Just wanted to pick up one point here, but I have to say thank you so much for bringing the whiteboard into the room, so to speak - those graphs you presented are such a helpful way of understanding the range of possible outcomes against a historical backdrop.The main thing I'd disagree with is that the salary cap on the DB portion of the scheme is set at a high level - it was set at a high level when it was introduced (55000 in 2015).It was dropped to 40,000 as of 2022.That's only just over half the original 2015 cap, in real terms (55000 2015 pounds is worth nearly 70000 now).Average full time salary in the UK is 33,000, and USS is only open to staff in professional roles, most of whom should be in a position to aspire to more than 1/5th over the average salary.
It is interesting to note that only about 9% of the remaining 5300 DB schemes in the UK are open to new members (https://www.thepensionsregulator.gov.uk/en/document-library/research-and-analysis/db-pensions-landscape-2022 ), but I have yet to find a nice reference that summarises the benefits of those that remain open (i.e., what is the distribution of inflation capping? What is the distribution of accrual rates? Are they final or career average salary? etc.).
As for the calculations, glad you found them useful. This has been on my to-do list for a while - I had most of the tools already in place, so this thread has brought it forward a bit. Suitably generalised, it might make a nice publication!
3 -
I suspect that, outside the Public Sector schemes, the details aren't in the public domainOldScientist said:
Thanks for that correction - I retired in 2019 and haven't kept up with everything going on in USS on the accrual side of things, so didn't notice that change. With a 2.5% inflation cap on the DB part, the DC component might provide more pension income for those at the beginning of their career at a university that uses USS (as mentioned upthread, those universities using the Teacher Pension have a huge advantage), so the reduction in salary cap may not now be such a bad thing as it would have been when it was a fully index linked pension. There is no doubt that the product is now considerably inferior to what it was only a decade ago and, it would appear, on a median 'historical probability' basis is coming close to being inferior to a DC pension. Whatever gold plating it once had has largely been scratched off!Universidad said:OldScientist said:the amount in the DB is capped (to be honest at a fairly high level, I only exceeded it just before I retired) with the excess going into what is actually a good DC scheme (limited, but adequate, selection of funds and very low costs).Just wanted to pick up one point here, but I have to say thank you so much for bringing the whiteboard into the room, so to speak - those graphs you presented are such a helpful way of understanding the range of possible outcomes against a historical backdrop.The main thing I'd disagree with is that the salary cap on the DB portion of the scheme is set at a high level - it was set at a high level when it was introduced (55000 in 2015).It was dropped to 40,000 as of 2022.That's only just over half the original 2015 cap, in real terms (55000 2015 pounds is worth nearly 70000 now).Average full time salary in the UK is 33,000, and USS is only open to staff in professional roles, most of whom should be in a position to aspire to more than 1/5th over the average salary.
It is interesting to note that only about 9% of the remaining 5300 DB schemes in the UK are open to new members (https://www.thepensionsregulator.gov.uk/en/document-library/research-and-analysis/db-pensions-landscape-2022 ), but I have yet to find a nice reference that summarises the benefits of those that remain open (i.e., what is the distribution of inflation capping? What is the distribution of accrual rates? Are they final or career average salary? etc.).
As for the calculations, glad you found them useful. This has been on my to-do list for a while - I had most of the tools already in place, so this thread has brought it forward a bit. Suitably generalised, it might make a nice publication!0 -
Very interesting analysis many thanks for sharing CM0
-
I suspect you are right. Although the proportion of those operating inflation caps can be found in the Purple Book (https://www.ppf.co.uk/sites/default/files/2022-11/PPF_PurpleBook_2022.pdf ), but how those caps are applied prior to retirement is critical (i.e., whole period or, like USS, annually).Andy_L said:
I suspect that, outside the Public Sector schemes, the details aren't in the public domainOldScientist said:
Thanks for that correction - I retired in 2019 and haven't kept up with everything going on in USS on the accrual side of things, so didn't notice that change. With a 2.5% inflation cap on the DB part, the DC component might provide more pension income for those at the beginning of their career at a university that uses USS (as mentioned upthread, those universities using the Teacher Pension have a huge advantage), so the reduction in salary cap may not now be such a bad thing as it would have been when it was a fully index linked pension. There is no doubt that the product is now considerably inferior to what it was only a decade ago and, it would appear, on a median 'historical probability' basis is coming close to being inferior to a DC pension. Whatever gold plating it once had has largely been scratched off!Universidad said:OldScientist said:the amount in the DB is capped (to be honest at a fairly high level, I only exceeded it just before I retired) with the excess going into what is actually a good DC scheme (limited, but adequate, selection of funds and very low costs).Just wanted to pick up one point here, but I have to say thank you so much for bringing the whiteboard into the room, so to speak - those graphs you presented are such a helpful way of understanding the range of possible outcomes against a historical backdrop.The main thing I'd disagree with is that the salary cap on the DB portion of the scheme is set at a high level - it was set at a high level when it was introduced (55000 in 2015).It was dropped to 40,000 as of 2022.That's only just over half the original 2015 cap, in real terms (55000 2015 pounds is worth nearly 70000 now).Average full time salary in the UK is 33,000, and USS is only open to staff in professional roles, most of whom should be in a position to aspire to more than 1/5th over the average salary.
It is interesting to note that only about 9% of the remaining 5300 DB schemes in the UK are open to new members (https://www.thepensionsregulator.gov.uk/en/document-library/research-and-analysis/db-pensions-landscape-2022 ), but I have yet to find a nice reference that summarises the benefits of those that remain open (i.e., what is the distribution of inflation capping? What is the distribution of accrual rates? Are they final or career average salary? etc.).
As for the calculations, glad you found them useful. This has been on my to-do list for a while - I had most of the tools already in place, so this thread has brought it forward a bit. Suitably generalised, it might make a nice publication!
Unfortunately, accrual rates are not covered in the Purple Book with only a throwaway line in the FAQs on the PPF site about many schemes being 1/80th (see https://www.ppf.co.uk/blog-posts/defined-benefit-pension-beliefs ).
1 -
It's gone from 1/75 accrual rate and was capped at 10%. Although it was a weird two tier cap: the first 5% matches the increase in official pensions, with half of the excess above 5% matched to a maximum of 10%.OldScientist said:
The changes to USS over the last 10 years going from 1/80th, final salary, fully index-linked to 1/85th, career average salary, inflation capped (currently 5%, soon to be 2.5%) coupled with an increase in contributions (both employee and employer) has caused many to question the value of the pension compared to alternatives - the type of calculations considered here are one facet of that questioning.mark5 said:
I would quite happily swap my dc pension with 3% employers contribution for your 1/85 plus x3 lump sum and widows pension.thegentleway said:
@hyubh I wonder if you'd be so kind as to clarify: are you saying my assumption of 5% growth is unlikely? I thought this was rather conservative since on average the stock market has returned 7% per year when accounting for inflation. You only need 2.74% growth to beat DB pension at 45 years from retirement...hyubh said:There's some maths in this very thread that suggests you'd be likely to do better with your own 10% contributions and damn the 20% your employer is throwing down.Hardly likely...Yes you don’t have the best db pension out there but you do have a better pension than the majority of the UK.Contribute to a defined contribution pension alongside your existing pension and see what it returns you in the future!
No one has ever become poor by giving0


Confirm your email address to Create Threads and Reply

Categories
- All Categories
- 354.6K Banking & Borrowing
- 254.5K Reduce Debt & Boost Income
- 455.5K Spending & Discounts
- 247.5K Work, Benefits & Business
- 604.4K Mortgages, Homes & Bills
- 178.6K Life & Family
- 262K Travel & Transport
- 1.5M Hobbies & Leisure
- 16.1K Discuss & Feedback
- 37.7K Read-Only Boards