We’d like to remind Forumites to please avoid political debate on the Forum.
This is to keep it a safe and useful space for MoneySaving discussions. Threads that are – or become – political in nature may be removed in line with the Forum’s rules. Thank you for your understanding.
📨 Have you signed up to the Forum's new Email Digest yet? Get a selection of trending threads sent straight to your inbox daily, weekly or monthly!
My system's performance - Using PVGIS to get an accurate generation?

Waywardmike
Posts: 206 Forumite


Hi all, this is really just a brain dump with a few questions, I may have just got particularly lucky with my install, it's performing spectacularly and I'm not sure if it's 'normal'. I would like other users opinions, especially those with a few years of data under their belt, and also wonder what others put into PVGIS to get an accurate prediction.
My system was installed in September 2014, by the end of this year I'll have 8 years of full data, although one of the years will need to be omitted, 2018, as we had a 'tin hat' covering the roof for the summer while we had our loft converted.
This is my total generation for this period. this year has been particularly amazing, currently at 4646kWh. One thing to note, is that this data I'm certain is pre-conversion to AC as it doesn't tally with my generation meter. If I compare, my generation meter is 97.8% of these numbers so fits in perfectly with the 97% efficiency stated in the specs for my inverter by SMA. So this year I've actually generated 4543.79kWh of useable leccy currently. like I said, from a 4kW system pretty amazing!

As you can see the prediction in Sunnyportal is way off, the details were inputted by the installer and I'm sure uses 3.68kW and my location and not much else.
My system in detail:
4kW Solarworld panels (16x250W All Black), 2 strings top and bottom.
3600tl Sunnyboy inverter
slightly southeast facing bungalow
no shading most of the year, minimal shading in winter (lamp post shadow goes across the bottom corner of the array), it's annoying but doesn't cause much loss in output.
We used to have an open field in front of us but that was built on in 2018 with a massive warehouse. so now the sun only hits us from about 8.30am onwards at this time of year.
in 2014 I used PVGIS to generate an estimate, I used the correct azimuth (-20°) and pitch (35°) for my system but left the 'system loss' at default, currently 14%, not sure what it was in 2014. this gave me a yearly average of 3892 kWh. Every year I've always exceeded that, which although a great position to be in, it gets tiring seeing year after year the prediction becoming less and less accurate.
If I set the system loss to 7.8% I get very close to my current average (from the meter not invereter). What do other users put in this box? How close are you all to your predictions? Has this last 7-8 years just been an anomaly and the predictions just don't stand?
Did I just really luck out and get a panel/inverter combination which really works? My inverter was in the loft for the first 4 years, but is now in a room so suffers no massive swings in ambient conditions anymore. It's also about 1.5m from the panels so there would be minimal loss from cabling while in DC.
Needless to say, my system paid for itself in FIT payments alone by the end of year 6 (would have been earlier if not for the loft conversion), so I'm more than happy.
I didn't have a lot of options at install, the only other options were Canadian Solar panels, slightly cheaper, I liked the idea of an all German system, and Solar Edge, which at £2k more wouldn't have made sense with my lack of shading. I did like the idea of panel level monitoring, I'm a scientist by profession so the more data the better but that still couldn't justify the cost difference.
That's a lot of writing just to ask how you set up your PVGIS prediction, but I thought some background would be nice to read.
Thanks all.
My system was installed in September 2014, by the end of this year I'll have 8 years of full data, although one of the years will need to be omitted, 2018, as we had a 'tin hat' covering the roof for the summer while we had our loft converted.
This is my total generation for this period. this year has been particularly amazing, currently at 4646kWh. One thing to note, is that this data I'm certain is pre-conversion to AC as it doesn't tally with my generation meter. If I compare, my generation meter is 97.8% of these numbers so fits in perfectly with the 97% efficiency stated in the specs for my inverter by SMA. So this year I've actually generated 4543.79kWh of useable leccy currently. like I said, from a 4kW system pretty amazing!
As you can see the prediction in Sunnyportal is way off, the details were inputted by the installer and I'm sure uses 3.68kW and my location and not much else.
My system in detail:
4kW Solarworld panels (16x250W All Black), 2 strings top and bottom.
3600tl Sunnyboy inverter
slightly southeast facing bungalow
no shading most of the year, minimal shading in winter (lamp post shadow goes across the bottom corner of the array), it's annoying but doesn't cause much loss in output.
We used to have an open field in front of us but that was built on in 2018 with a massive warehouse. so now the sun only hits us from about 8.30am onwards at this time of year.
in 2014 I used PVGIS to generate an estimate, I used the correct azimuth (-20°) and pitch (35°) for my system but left the 'system loss' at default, currently 14%, not sure what it was in 2014. this gave me a yearly average of 3892 kWh. Every year I've always exceeded that, which although a great position to be in, it gets tiring seeing year after year the prediction becoming less and less accurate.
If I set the system loss to 7.8% I get very close to my current average (from the meter not invereter). What do other users put in this box? How close are you all to your predictions? Has this last 7-8 years just been an anomaly and the predictions just don't stand?
Did I just really luck out and get a panel/inverter combination which really works? My inverter was in the loft for the first 4 years, but is now in a room so suffers no massive swings in ambient conditions anymore. It's also about 1.5m from the panels so there would be minimal loss from cabling while in DC.
Needless to say, my system paid for itself in FIT payments alone by the end of year 6 (would have been earlier if not for the loft conversion), so I'm more than happy.
I didn't have a lot of options at install, the only other options were Canadian Solar panels, slightly cheaper, I liked the idea of an all German system, and Solar Edge, which at £2k more wouldn't have made sense with my lack of shading. I did like the idea of panel level monitoring, I'm a scientist by profession so the more data the better but that still couldn't justify the cost difference.
That's a lot of writing just to ask how you set up your PVGIS prediction, but I thought some background would be nice to read.
Thanks all.
4 Kwp System, South Facing, 35 Degree Pitch, 16 x 250W Solarworld Panels, SMA Sunnyboy 3600 Inverter, Installed 02/09/14 in Sunny South Bedford - £5600
Growatt AC Coupled SPA3000tl and 6.5kWh battery Installed Apr 2022
Growatt AC Coupled SPA3000tl and 6.5kWh battery Installed Apr 2022
2
Comments
-
2015 Install, 4kWp just S of E panels.
PVGIS calc at the time 3.4GWh pa, actual in range 3.51 - 3.89, average 3.77.
I think they may have tweaked the PVGIS calculator since I did my figures just after install?
Just checked, there seem to be more options than I remember when I did mine but my results correspond to Sarah2,14% (the defaults)I think....3 -
I have exactly the same 3400 PVGIS as you. Actual production excluding this year, is in the range 3.56 - 3.96 with an average of 3.75.michaels said:2015 Install, 4kWp just S of E panels.
PVGIS calc at the time 3.4GWh pa, actual in range 3.51 - 3.89, average 3.77.
I think they may have tweaked the PVGIS calculator since I did my figures just after install?
Just checked, there seem to be more options than I remember when I did mine but my results correspond to Sarah2,14% (the defaults)
This year has been stellar & currently stands at 4.23.4kWp (black/black) - Sofar Inverter - SSE(141°) - 30° pitch - North LincsInstalled June 2013 - PVGIS = 3400Sunsynk Ecco Inverter & Pylontech 5x US2000, 3x US3000, 3x US5000 Batteries - 37kWh3 -
Indeed, 2022 has been an exceptional solar year. My SolarEdge prediction for 2022 was 5470kWh. My actual achievement was 6147 kWh.
Solar generation is a bit like the stock market: estimates are not a sound predictor of solar panel performance in any given year.3 -
It';s not just you, 2022 has been an exceptional year. Ours did 3522kWh from 3kWp panels which equates to 1174 kWh per kWp.
Yours is 4646kWh for 4kWp = 1161 kWh per kWp.
Both are very good outputs for the UK but I've also found the PVGIS results to be an underestimate of what can be generated. Maybe that's deliberate so they're not accused of overstating the benefits of solar.Remember the saying: if it looks too good to be true it almost certainly is.0 -
Yes this year has been something else - 4689.4kWh generated in the end. 120.5% of PVGIS
But even my lowest year up to 2022 has been 103.4% of PVGIS.
2015 - 112.4%
2016 - 111.7%
2017 - 104.9%
2018 - N/A
2019 - 115.1%
2020 - 115%
2021 - 103.4%
There's off and there's off, I just wondered whether I lucked out with a super efficient system or PVGIS is just garbage.4 Kwp System, South Facing, 35 Degree Pitch, 16 x 250W Solarworld Panels, SMA Sunnyboy 3600 Inverter, Installed 02/09/14 in Sunny South Bedford - £5600
Growatt AC Coupled SPA3000tl and 6.5kWh battery Installed Apr 20221 -
The first PVGIS calculation for my system predicted 5320kWh. A later version (v5 I think) predicted 6044.5 kWh.
I suspect from some of the reports I have seen on the forum that those who installed their systems a few years ago might have calculated their PVGIS projection using the older version and haven’t re run the calculation on the later version. Any reference to performance against PVGIS without mentioning the version is meaningless.The first couple of years (2019 and 2020) I made 97.4 and 98.0 % of the V5 projection. Since then I have had issues with some panels meaning I only achieved 88.5 and 92.4% in 2021 and 2022.Had I been using the earlier version I would have comfortably beaten the projection in 2019, 2020 and 2022 and just beaten it in 2021. What I have found with my E/W system is that the winter month projections are too high. My December performance over 5 years (2018 - 2022) has been 82%, 90.6%, 70.2%, 54.7% and 74.4%Northern Lincolnshire. 7.8 kWp system, (4.2 kWwest facing panels , 3.6 kWeast facing), Solis inverters installed 2018, 5kW SSE facing system (shaded in afternoon) added in 2025 with Tesla PW3 battery, Mitsubishi SRK35ZS-S and SRK20ZS-S Wall Mounted A2A Heat Pumps, ex Nissan Leaf owner.0 -
@JKenH how does this new version affect older systems? Is this improvement in prediction to factor in marginal improvement in tech?“Don't raise your voice, improve your argument." - Desmond Tutu
Solar - 9.2 KWp + Enphase IQ7+ and IQ8AC (Feb 22 & Sep 24) + Givenergy AC Coupled inverter + 2 * 8.2KWh Battery (May 2022) + Mitsubishi 7.1 KW and 2* Daikin 2.5 KW A2A Heat Pump
Vaillant Arotherm + 10KW A2W Heat Pump + Open energy monitoring0 -
@ispookie666 I am sorry but I don’t know what the changes to the algorithm are or why it was deemed necessary to update. These are my calculations transferred to a spreadsheet. V5 version on top, original version below (I had done a comparison to south facing panels just for fun). The original version is much closer to my actual winter generation whereas the v5 is more representative of actual summer performance.ispookie666 said:@JKenH how does this new version affect older systems? Is this improvement in prediction to factor in marginal improvement in tech?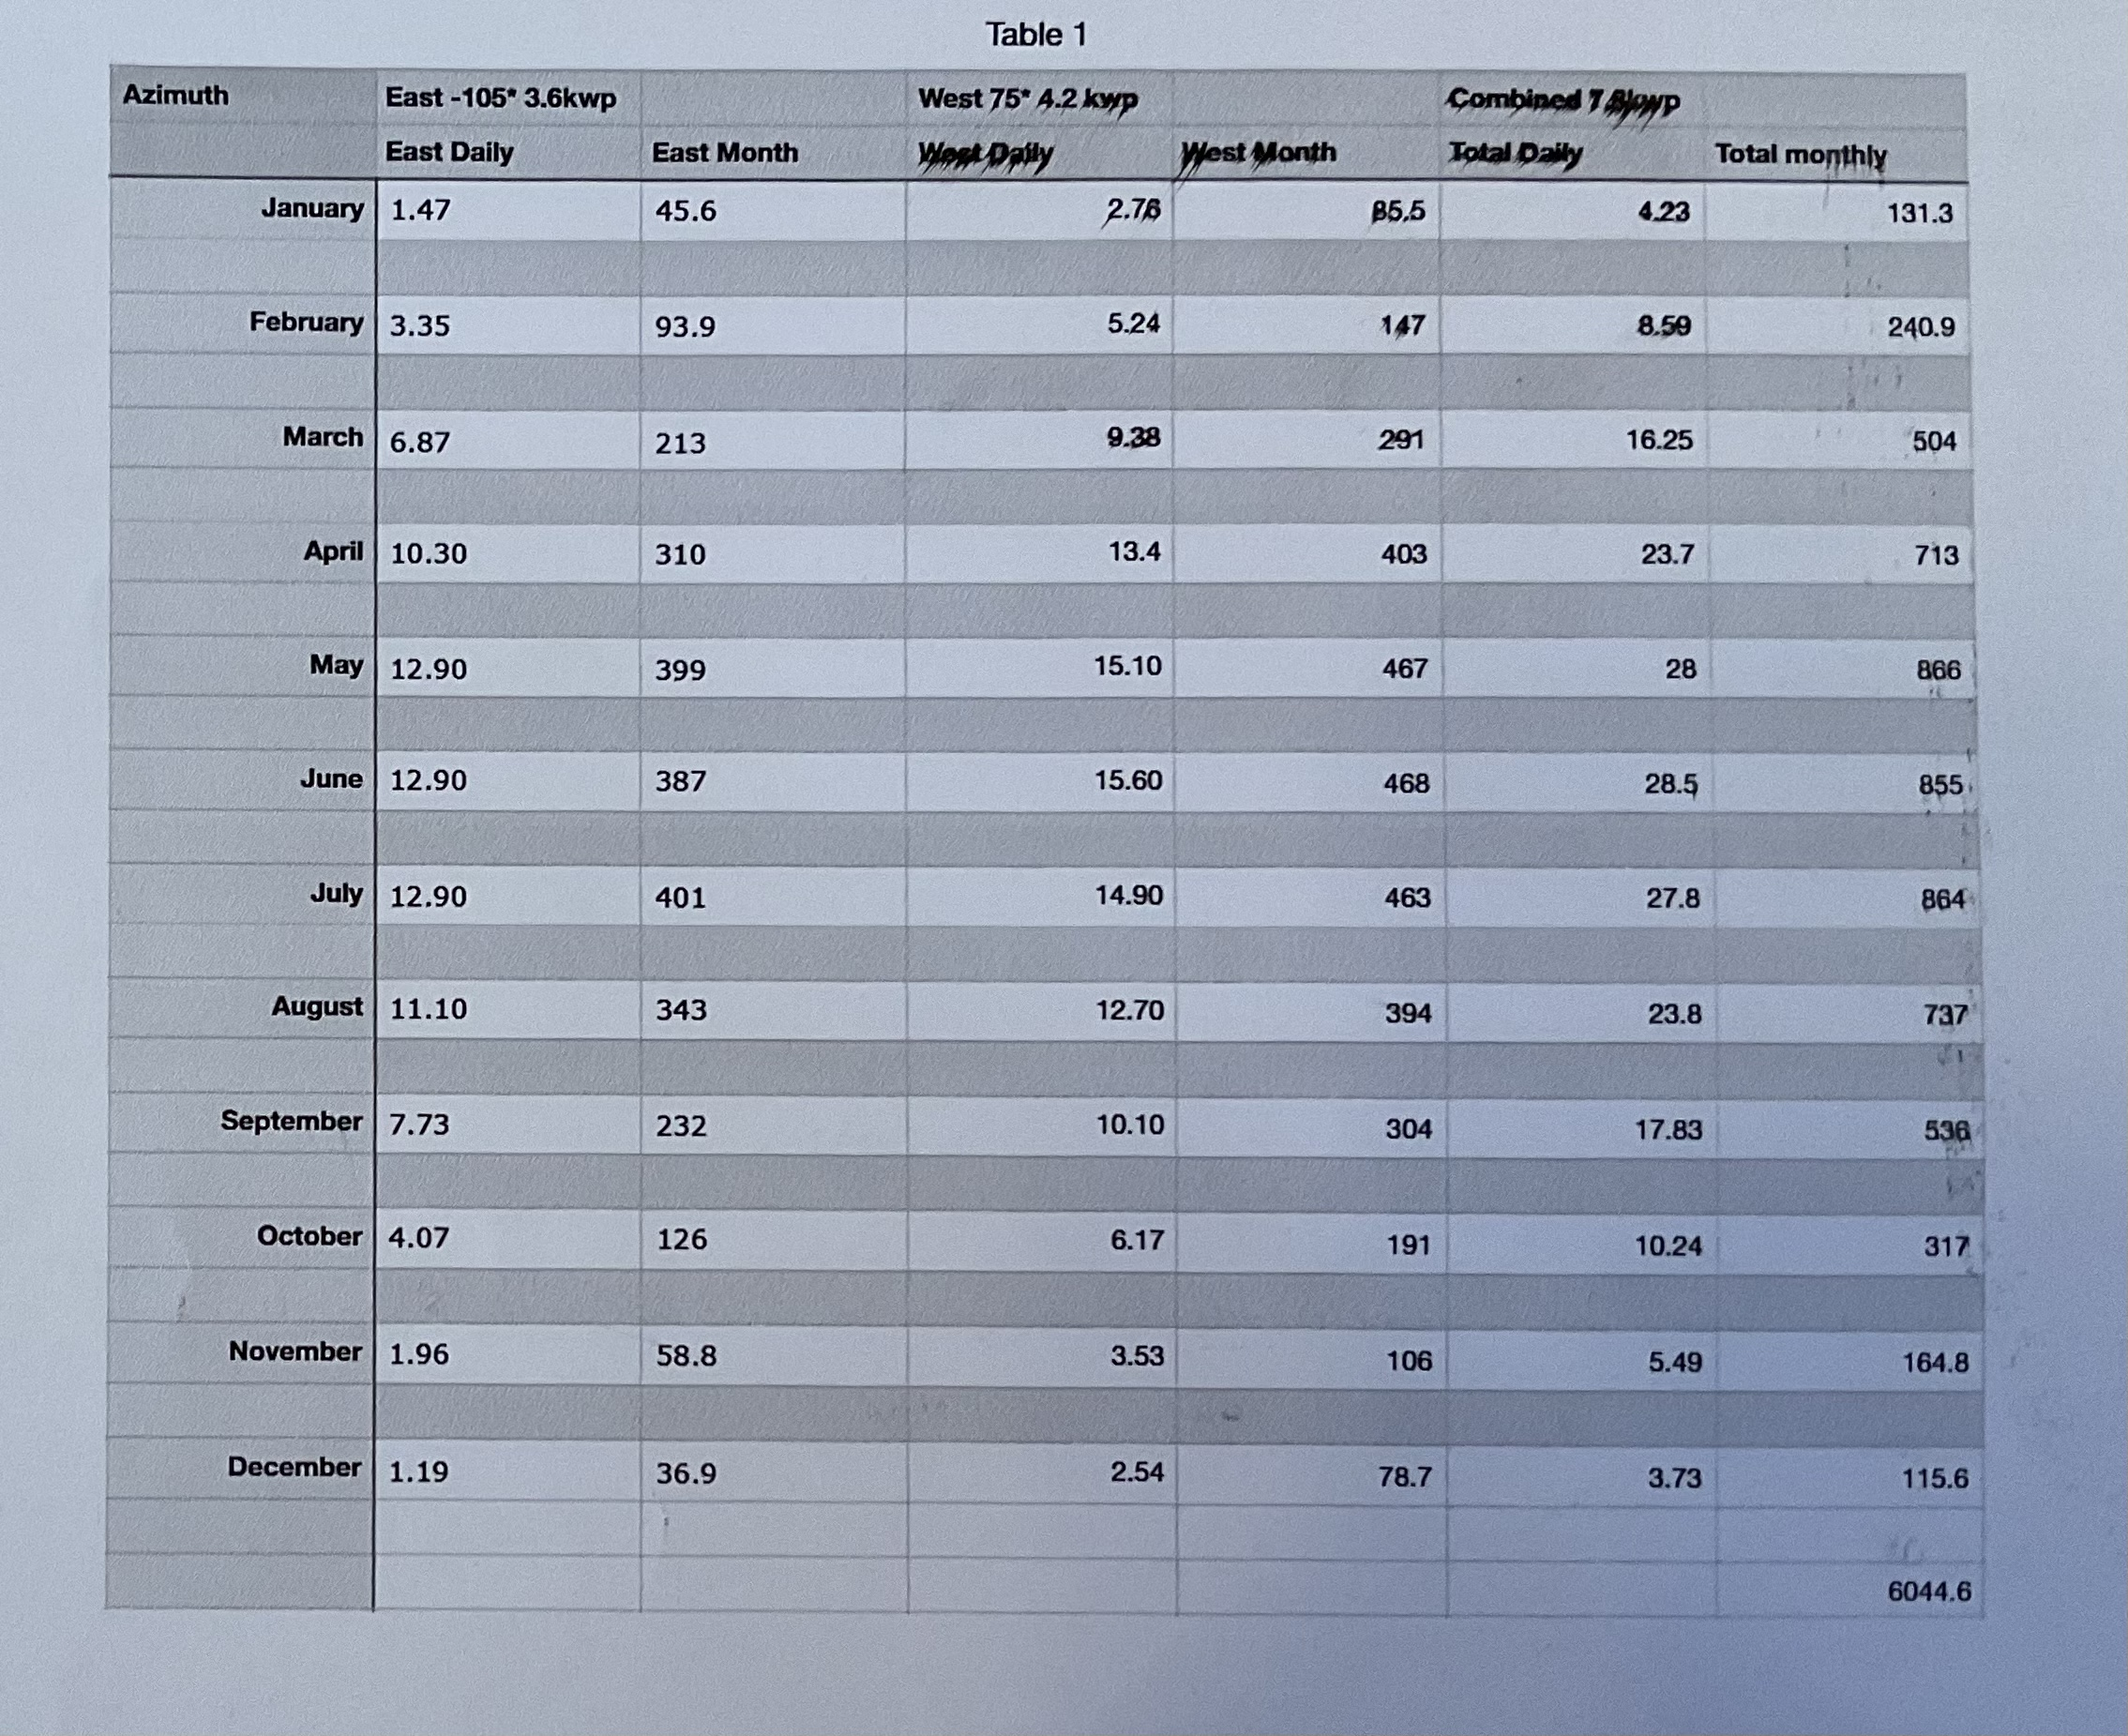
 Northern Lincolnshire. 7.8 kWp system, (4.2 kWwest facing panels , 3.6 kWeast facing), Solis inverters installed 2018, 5kW SSE facing system (shaded in afternoon) added in 2025 with Tesla PW3 battery, Mitsubishi SRK35ZS-S and SRK20ZS-S Wall Mounted A2A Heat Pumps, ex Nissan Leaf owner.0
 -
Hiya, it's a small change, it boosted targets by about 2.7%. Looking back at my spreadsheet it means my first 5 or so years are slightly flattering, but my lowest figure, since updating is still 104% of PVGIS target, despite the fact that I have shading. Though Solaredge does its best to minimise those losses, and a ~99% efficient inverter replaced two smaller SMA's with a weighted average of about 94%.ispookie666 said:@JKenH how does this new version affect older systems? Is this improvement in prediction to factor in marginal improvement in tech?
[Edit - forgot to say, as I recall, PVGIS revised their figures when they were able to include local weather impacts, as well as average solar levels. In some areas, such as coastal for example, cooling can boost gen, whereas an equally sunny area nearby, may not get such a benefit. Also, the running 10yr average for solar levels has been rising.]
PVGIS has, as far back as I can recall (2012 maybe) used the default 14% figure for losses. This has always been seen as being a bit high, and more so as the last decade went on, and inverter efficiency rose a few percent.
My suggestion (on threads on here) has always been to leave the defaults alone (unless you really find it interesting), and that way you should get a buffer, and probably more generation than you expect ..... albeit a silly psychological trick.
When I had my install done, the installers were only allowed to use the UK SAP figure (later updated to different SAP figures across the UK). As this was based on research at Sheffield University, it meant a strange situation, where everyone south of Sheffield could expect better gen, and those north, worse. Installers weren't allowed to say (in my case) that gen would be better, but they could hint, and show charts of the UK with different irradiance levels*, to 'help' guide you. I think the south facing SAP figure for my house was about 850kWh/kWp, PVGIS is about 1,010. But I have a nagging thought that the SAP figure was supposed to be an average, and therefore had a built in degradation for the (original) 25yr FiT period.
* something like this
Mart. Cardiff. 8.72 kWp PV systems (2.12 SSW 4.6 ESE & 2.0 WNW). 28kWh battery storage. Two A2A units for cleaner heating. Two BEV's for cleaner driving.
For general PV advice please see the PV FAQ thread on the Green & Ethical Board.1 -
If anyone is interested in rising sunshine levels, then I can strongly recommend the Met Office Anomaly Maps.
Looking at the sunshine for 2022 in S. Wales were I am, it was a great year v's the 1961-1990 figures, about 110-115%, but only 105-110% of the 1981-2010 average, but close to average v's the 1991-2020 average.
Mart. Cardiff. 8.72 kWp PV systems (2.12 SSW 4.6 ESE & 2.0 WNW). 28kWh battery storage. Two A2A units for cleaner heating. Two BEV's for cleaner driving.
For general PV advice please see the PV FAQ thread on the Green & Ethical Board.1


Confirm your email address to Create Threads and Reply

Categories
- All Categories
- 354.8K Banking & Borrowing
- 254.6K Reduce Debt & Boost Income
- 455.6K Spending & Discounts
- 247.7K Work, Benefits & Business
- 604.6K Mortgages, Homes & Bills
- 178.7K Life & Family
- 262.3K Travel & Transport
- 1.5M Hobbies & Leisure
- 16.1K Discuss & Feedback
- 37.7K Read-Only Boards