We’d like to remind Forumites to please avoid political debate on the Forum.
This is to keep it a safe and useful space for MoneySaving discussions. Threads that are – or become – political in nature may be removed in line with the Forum’s rules. Thank you for your understanding.
📨 Have you signed up to the Forum's new Email Digest yet? Get a selection of trending threads sent straight to your inbox daily, weekly or monthly!
The Forum now has a brand new text editor, adding a bunch of handy features to use when creating posts. Read more in our how-to guide
Energy use profile


I was thinking how it might be useful for tracking energy usage to have a profile of how usage typically varies for each week of the year.So for a house with an annual usage of 20000 kWh, the weekly average would be 384 kWh, but the 3rd week of January might on average be 800kWh and the 3rd week of July might be 80kWh. So I'm looking for that profile information that would show the average usage for each week over the course of a year. Obviously it would vary according the nature of the property and whether it has gas or electric cooking, heating and so on so for me I'm looking for data a 3 bed semi with gas CH, water and cooker. I've searched with Google but cannot find the type of information I am after and I wondered whether anyone might know of somewhere this detail of information is published? Thanks.
0
Comments
-
This detail for your own usage is probably available on your online account. There is little point in comparing yours with anyone else's as every case is different.Living the dream in the Austrian Alps.1
-
How complicated do you want the data to be?
There are several datasets that could assist with your enquiry, but they’re collected together in some ‘unusual’ ways.
To get data like you would suggest (3 bed, semi, GCH…) would be a research project in itself, but you might be able to pull something together from what I know of.
Data tends to be daily profiles for types of use in different seasons (normally either 5 or 6) because that is the most useful for system planning.0 -
The trouble with any sort of average/typical use is that there can be huge variation from this. It can be helpful for the likes of the government but for the individual consumer what really matters is how much energy they use.
Was their a particular reason you asked this question?0 -
Indeed. An average averages out building age, how well insulated it is, where it's situated (including which way it faces and how exposed it is), size of property, types of layout, all sorts. Then you've got the vast range of occupants, how many, what they like to do, their health and comfort levels, any particular needs, etc.Ultrasonic said:The trouble with any sort of average/typical use is that there can be huge variation from this. It can be helpful for the likes of the government but for the individual consumer what really matters is how much energy they use.
I actually think it would be even less use than the regional average mythical 'cap' because at least that translates to unit amounts, whereas actual usage even in the same type of property with the same number of bedrooms is infinitely variable.
I'd have thought usage generally trends in a U shape, if plotted on a line graph from January to December. The main unknown would be how steep the gradients are either side.1 -
My rationale is that getting a smart meter to learn that I've used 50kWh or spent £4.20 in a day or a week or whatyever is to me useless because there is no context. There needs to be something to compare against and that something is significantly dependant on the time of year. I decided on weeks because that is a managable amount of data with decent resolution to the curve whilst tending to smooth the short term peaks and troughs that a daily basis to the data would produce.
I would have expected that the basic shape of the curve would be similar for all properties with just the amplitude and the offset differing. There must be a wealth of data from all the smart meters there are out there from which the type of data I am looking for could be generated.
0 -
TransmitThis said:I've used 50kWh or spent £4.20 in a day or a week or whatyever is to me useless because there is no context.Surley the context is the apliances you use during that period?No, the context is knowing whether I'm using more or less energy than I would expect to at that time. and the data gives me a baseline in order to do that. I can then think about appliance usage and decide what to use less if it would be useful do do so. Maybe it's my engineering background, but it's the way I thinkAnyway thanks for your input. I will need to think of something different.
0 -
The best thing for you might be the Auxilione predictions that were being done for the price cap. I’m not sure of their source data but it would save you creating your own.Tiptonian said:TransmitThis said:I've used 50kWh or spent £4.20 in a day or a week or whatyever is to me useless because there is no context.Surley the context is the apliances you use during that period?No, the context is knowing whether I'm using more or less energy than I would expect to at that time. and the data gives me a baseline in order to do that. I can then think about appliance usage and decide what to use less if it would be useful do do so. Maybe it's my engineering background, but it's the way I thinkAnyway thanks for your input. I will need to think of something different.
They gave the typical annual usage broken down by month - so would give you the sort of curve you are after. It was based on a dual fuel user, so gas was very seasonal and electricity much flatter.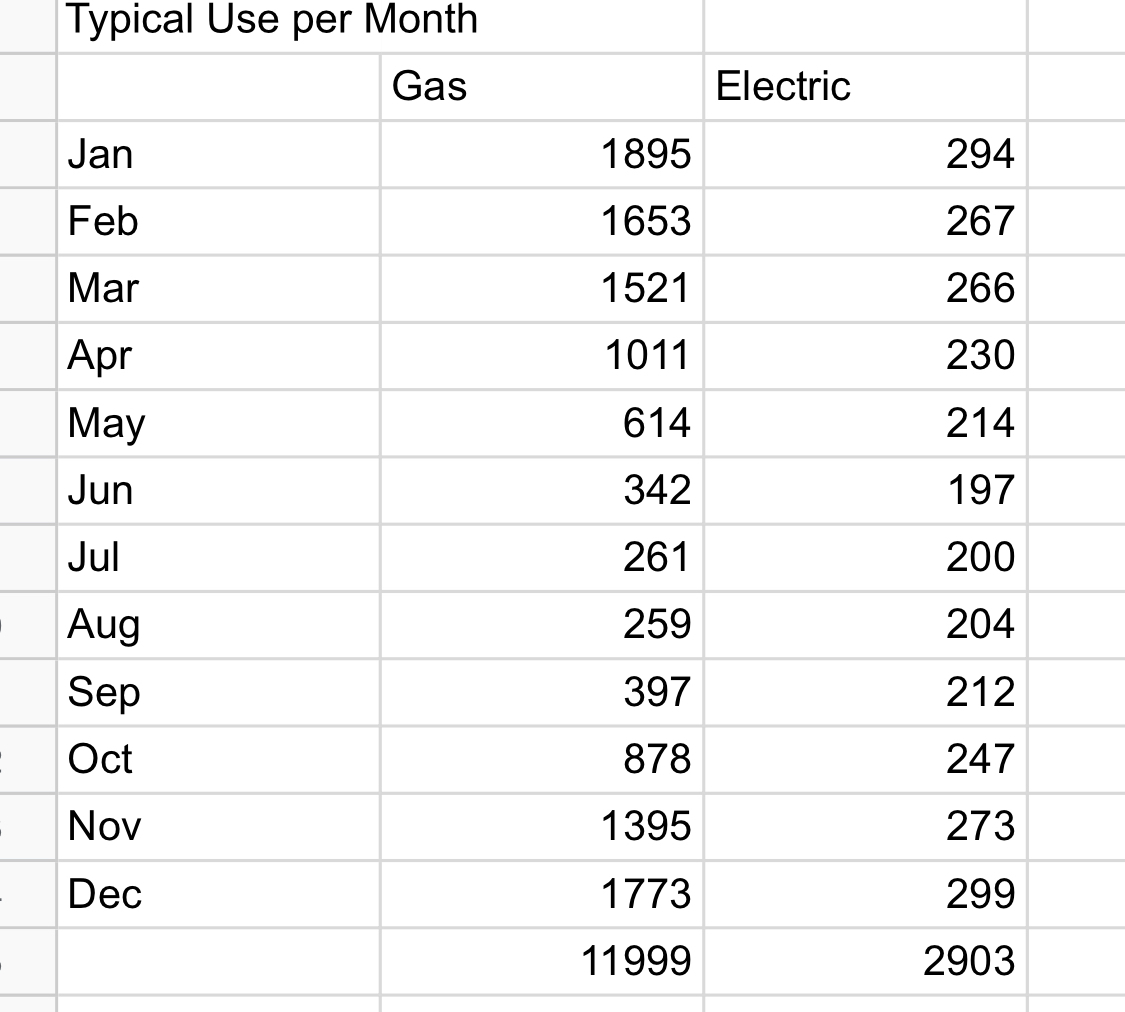 A quick bit of multiplication and you can apply this curve to any annual usage.
Would probably be more accurate using your own historic data, but this should do if you don’t have that.0


Confirm your email address to Create Threads and Reply

Categories
- All Categories
- 353.6K Banking & Borrowing
- 254.2K Reduce Debt & Boost Income
- 455.1K Spending & Discounts
- 246.7K Work, Benefits & Business
- 603K Mortgages, Homes & Bills
- 178.1K Life & Family
- 260.7K Travel & Transport
- 1.5M Hobbies & Leisure
- 16K Discuss & Feedback
- 37.7K Read-Only Boards