We’d like to remind Forumites to please avoid political debate on the Forum.
This is to keep it a safe and useful space for MoneySaving discussions. Threads that are – or become – political in nature may be removed in line with the Forum’s rules. Thank you for your understanding.
📨 Have you signed up to the Forum's new Email Digest yet? Get a selection of trending threads sent straight to your inbox daily, weekly or monthly!
The Forum now has a brand new text editor, adding a bunch of handy features to use when creating posts. Read more in our how-to guide
Winter stats and the real savings made

EcoScruples
Posts: 430 Forumite


Calling all long term solar users, I'm sure lots of new people are wondering like me what the real savings are over a winter period, Nov to Jan especially.
How much of the solar you generate do you use?
Do you have a battery and if so how does that effect your winter usage? Do you find that you use 99% of what you generate?
Also what's the long term average of what you generate to what you export?
Stats, graphs and data would be very welcome.
How much of the solar you generate do you use?
Do you have a battery and if so how does that effect your winter usage? Do you find that you use 99% of what you generate?
Also what's the long term average of what you generate to what you export?
Stats, graphs and data would be very welcome.
4.3kwp JA panels, Huawei 3.68kw Hybrid inverter, Huawei 10kw Lunar 2000 battery, Myenergi eddi, South facing array with a 15 degree roof pitch, winter shade.
0
Comments
-
My experience has been that December and January are pretty terrible for solar.
- December 2021 was particularly poor; I generated 15 O's all month.
- January is almost always better than December and January 2022 followed the trend; 31 O's generated.
Over those two months I generated 125kWh and exported 24kWh. At the time I only had a tiny 1kWh battery; if I'd had even 2kWh I'd have exported much less, maybe 5kWh total.With 101kWh of self-consumption, savings at the then-SVT of 21p/kWh would have been about £21. In practice I was on Go and so my savings were more like £16.I suppose the point I'm trying to make is - the savings from solar are made in the two summer quarters, not the two winter ones.N. Hampshire, he/him. Octopus Intelligent Go elec & Tracker gas / Vodafone BB / iD mobile. Kirk Hill Co-op member.Ofgem cap table, Ofgem cap explainer. Economy 7 cap explainer. Gas vs E7 vs peak elec heating costs, Best kettle!
2.72kWp PV facing SSW installed Jan 2012. 11 x 247w panels, 3.6kw inverter. 35 MWh generated, long-term average 2.6 Os.3 -
That's useful info thank you, I'm curious how my battery will do in winter, I know it will remain empty for ling periods but I'm assuming that means anything I generate will be used by me or my battery.
I can't imagine there will be many days I'll get the 10kw I need.4.3kwp JA panels, Huawei 3.68kw Hybrid inverter, Huawei 10kw Lunar 2000 battery, Myenergi eddi, South facing array with a 15 degree roof pitch, winter shade.0 -
Here's a site near me with a similar array to mine and with 10 years of data on PVGIS:EcoScruples said:That's useful info thank you, I'm curious how my battery will do in winter, I know it will remain empty for ling periods but I'm assuming that means anything I generate will be used by me or my battery.
I can't imagine there will be many days I'll get the 10kw I need.(If you look you might be able to find a site near you with a 4kWp array, that you can compare yours with.)October to February they're producing, on average, less than 2O's a day - the "efficiency" column (there's the occasional exception). Since you need 2.5 O's to fill your 10kWh battery from your 4kWp array, plus you have daytime loads to service, you can expect your battery to be very rarely full (and quite often empty) for those five months.If you have a multi-rate tariff, those are the months to consider charging your battery during the cheap-rate period.N. Hampshire, he/him. Octopus Intelligent Go elec & Tracker gas / Vodafone BB / iD mobile. Kirk Hill Co-op member.Ofgem cap table, Ofgem cap explainer. Economy 7 cap explainer. Gas vs E7 vs peak elec heating costs, Best kettle!
2.72kWp PV facing SSW installed Jan 2012. 11 x 247w panels, 3.6kw inverter. 35 MWh generated, long-term average 2.6 Os.2 -
I'm still on Octopus Go @ 5p/kWh
The average cost of import (inc vat) over the past 8 months has been quite consistent:
Nov: 6.01
Dec: 6.28
Jan: 5.55
Feb: 5.62
Mar: 5.71
Apr: 5.58
May: 5.88
Jun: 5.67
Total export this year is 58kWh verses generation of 2511kWh - 98% utilisation.
4kWp (black/black) - Sofar Inverter - SSE(141°) - 30° pitch - North LincsInstalled June 2013 - PVGIS = 3400Sofar ME3000SP Inverter & 5 x Pylontech US2000B Plus & 3 x US2000C Batteries - 19.2kWh1 -
From March to end of October you should do pretty well.
November to Feb will be poor, you should expect to consume everything pretty much in those months.
This is a 4kw array pointing sse in central Scotland last year.
Ignore the first couple of months export, inverter was set wrong.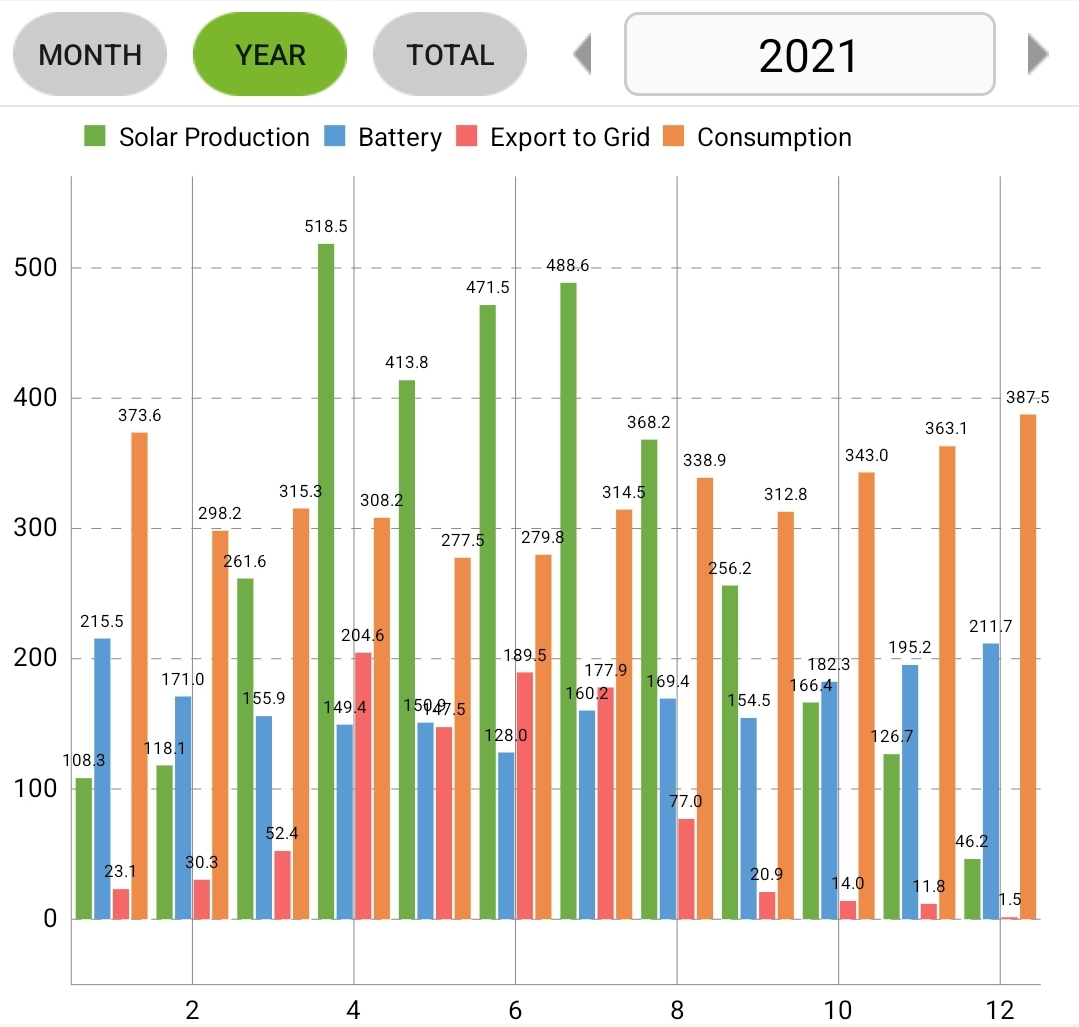
Battery usage is from charging using octopus go faster and then running the house in that chargeWest central Scotland
4kw sse since 2014 and 6.6kw wsw / ene split since 2019
24kwh leaf, 75Kwh Tesla and Lux 3600 with 60Kwh storage2 -
My target monthly average will be around 350kw.
I'd written off Dec/Jan/Feb and also part of Oct/Nov so I guess 7 months good production might smooth out those other 5.
Interesting to see what people make in those dark months, what are people's longest non generation periods? Days? Weeks?4.3kwp JA panels, Huawei 3.68kw Hybrid inverter, Huawei 10kw Lunar 2000 battery, Myenergi eddi, South facing array with a 15 degree roof pitch, winter shade.0 -
EcoScruples said:Interesting to see what people make in those dark months, what are people's longest non generation periods? Days? Weeks?Not my graph - this is @Patrol 's 5.44kWp system last December (from here). Mine was a similar shape but roughly half the value.
 Less than an O each day from the 6th to the 14th (and I'm not sure about the 5th!), and for the whole second half of the month from the 17th to the 31st.Or, put another way, more than an O on 5 days max all month.N. Hampshire, he/him. Octopus Intelligent Go elec & Tracker gas / Vodafone BB / iD mobile. Kirk Hill Co-op member.Ofgem cap table, Ofgem cap explainer. Economy 7 cap explainer. Gas vs E7 vs peak elec heating costs, Best kettle!
2.72kWp PV facing SSW installed Jan 2012. 11 x 247w panels, 3.6kw inverter. 35 MWh generated, long-term average 2.6 Os.1 -
I think we average about 120kwh in Nov, 70 in Dec and 100 in Jan on a 4kw system that does about 3.6Mwh per year total - over 7 years. However it is W facing, according to pvgis, a S facing system shouldn't suffer quite so badly in winter.I think....1
-
Thanks guys, really appreciate all the feedback info.
Although mine is south facing I think it will suffer a bit more in the winter due to its shallow angle but we'll see.
4.3kwp JA panels, Huawei 3.68kw Hybrid inverter, Huawei 10kw Lunar 2000 battery, Myenergi eddi, South facing array with a 15 degree roof pitch, winter shade.0 -
Hiya, if you use the PVGIS tool, it will give a monthly breakdown of the annual guesstimate in a graph.
For a south facing 35d pitch roof, you'll probably see a best to worth month ratio of about 4:1, maybe 3.5:1 if steep pitched (50d), and 4.5:1 if shallower. But, as they say 'results may vary', and shading can be more severe in the winter when the sun is lower.
I have an E/W install, so my difference is about 7:1. :'(
PS - Just to rub it in for us Brits, if you pop the PVGIS pin in southern Spain, then 1kWp of PV at a steep 50d pitch will vary from about 115kWh worst months to about 150kWh best months ...... I'm very jealous.Mart. Cardiff. 8.72 kWp PV systems (2.12 SSW 4.6 ESE & 2.0 WNW). 28kWh battery storage. Two A2A units for cleaner heating. Two BEV's for cleaner driving.
For general PV advice please see the PV FAQ thread on the Green & Ethical Board.2


Confirm your email address to Create Threads and Reply

Categories
- All Categories
- 354.2K Banking & Borrowing
- 254.4K Reduce Debt & Boost Income
- 455.3K Spending & Discounts
- 247.2K Work, Benefits & Business
- 603.8K Mortgages, Homes & Bills
- 178.4K Life & Family
- 261.4K Travel & Transport
- 1.5M Hobbies & Leisure
- 16.1K Discuss & Feedback
- 37.7K Read-Only Boards