We’d like to remind Forumites to please avoid political debate on the Forum.
This is to keep it a safe and useful space for MoneySaving discussions. Threads that are – or become – political in nature may be removed in line with the Forum’s rules. Thank you for your understanding.
📨 Have you signed up to the Forum's new Email Digest yet? Get a selection of trending threads sent straight to your inbox daily, weekly or monthly!
The Forum now has a brand new text editor, adding a bunch of handy features to use when creating posts. Read more in our how-to guide
Excel Help
Comments
-
JohnSwift10 said:Now to figure out how to do a pivot table
- Highlight all your data including a column heading for your two columns (date&time, consumption)
- Go to Insert > Pivot Table and click ok

- Drag "Date" down to the "Rows" box
- Drag "Consumption" down to the Values box
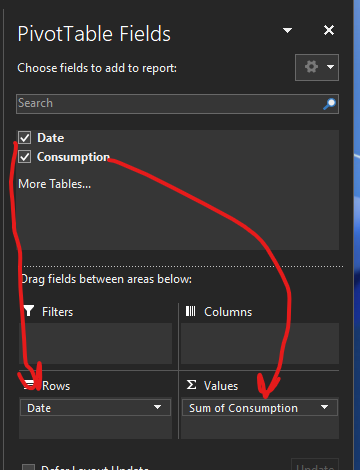
- Then click on any cell in the Row Labels column on the pivot on the sheet and go to the menu PivotTable Analyze > Group Selection
- In the pop up, highlight "Days" only by clicking and clicking on it as per screenshot below.

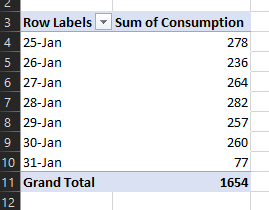
- Click ok then you will have this:
- Pivots are really powerful for this kind of work for several reasons:
- Not fiddly like formulas, less likely to make mistakes
- If you actually highlight column A and B in step one, the pivot can use any future data you add to it, all you need to do is right click on the pivot and select "Refresh" to include new data
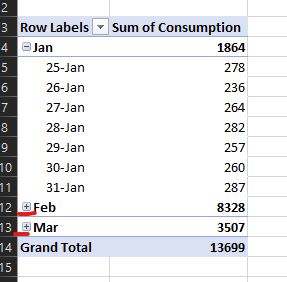
- If you select "month" as well in step 6 so can have your pivot group by both days and months like this with expandable "+" symbols:
- You can also transform the data easily into different cuts - so here is the hours listed and the consumption during each hourly period for months of Jan and Feb.

3 -
Thanks tallmansix
1
![[Deleted User]](https://us-noi.v-cdn.net/6031891/uploads/defaultavatar/nFA7H6UNOO0N5.jpg)


Confirm your email address to Create Threads and Reply

Categories
- All Categories
- 353.5K Banking & Borrowing
- 254.1K Reduce Debt & Boost Income
- 455K Spending & Discounts
- 246.6K Work, Benefits & Business
- 602.9K Mortgages, Homes & Bills
- 178K Life & Family
- 260.5K Travel & Transport
- 1.5M Hobbies & Leisure
- 16K Discuss & Feedback
- 37.7K Read-Only Boards