We’d like to remind Forumites to please avoid political debate on the Forum.
This is to keep it a safe and useful space for MoneySaving discussions. Threads that are – or become – political in nature may be removed in line with the Forum’s rules. Thank you for your understanding.
📨 Have you signed up to the Forum's new Email Digest yet? Get a selection of trending threads sent straight to your inbox daily, weekly or monthly!
The Forum now has a brand new text editor, adding a bunch of handy features to use when creating posts. Read more in our how-to guide
Investment Valuation information - what ARE all these figures and what do they mean?
Comments
-
Edit: trustnet doesn't have Amazon, but as it has never paid dividends I can use their share price and exchange rate to get:
(134.52÷1.6148) ÷ (76.13÷1.6121) -1 =76.4%
Less than Tesco, at least over that period.
There will always be - much easier to find in hindsight - the odd few who do actually make it through their technological revolution. Good luck finding them.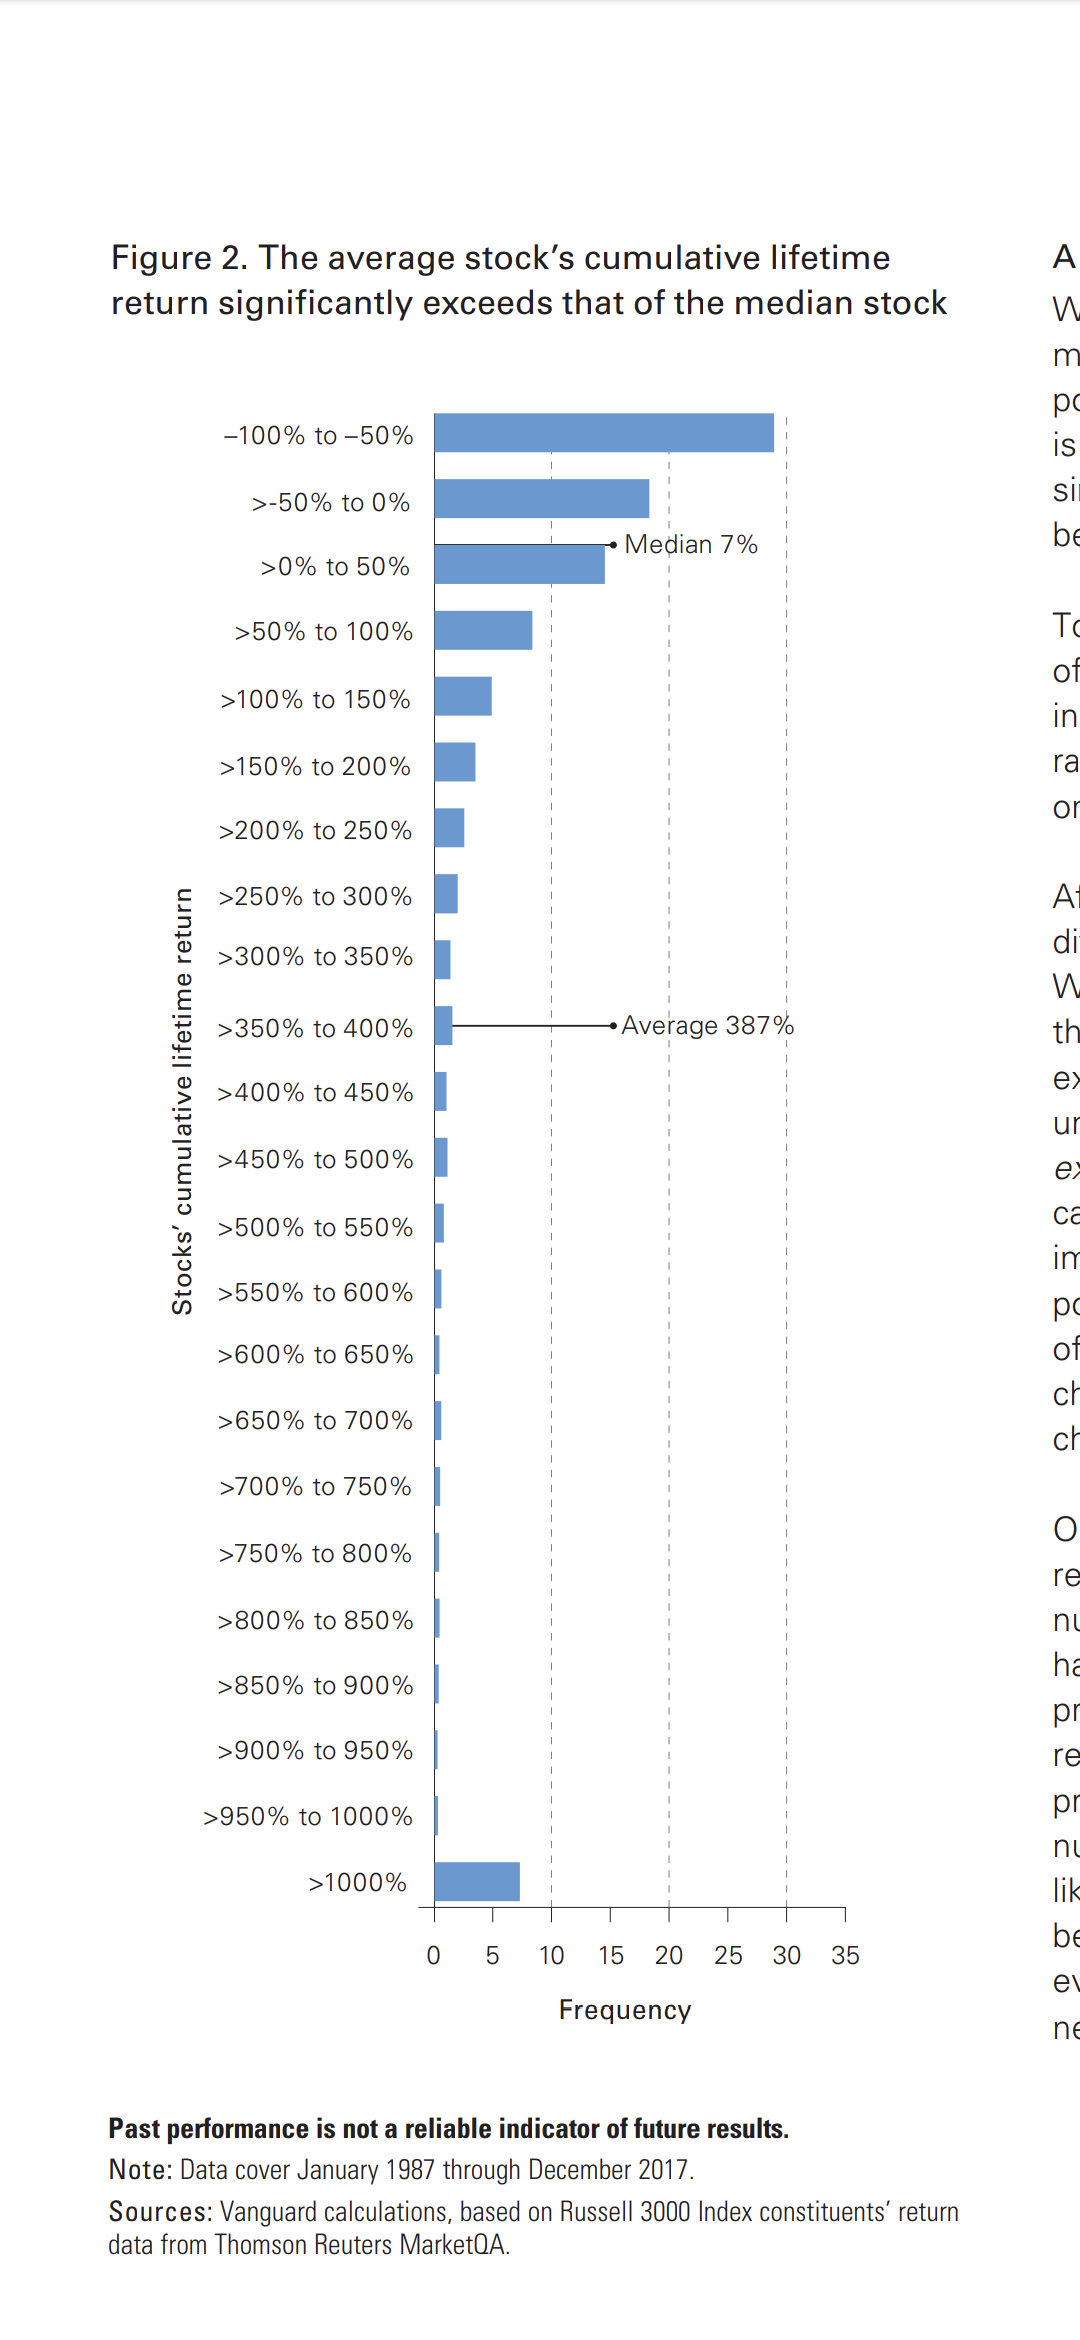
Source: https://www.google.com/url?sa=t&source=web&rct=j&url=https://www.vanguardinvestments.dk/documents/institutional/increase-odds-of-owning-less-stock-that-drive-returns.pdf&ved=2ahUKEwjXxc-h2fnyAhVinFwKHThsAyoQFnoECAQQAQ&usg=AOvVaw2xzbnhbJiJPf3q8PdL-YRF0 -
Didn't Amazon also drop more than 95% in 2001 ? Brave to hold onto that one at the time.0
-
Very different business back then.Bobziz said:Didn't Amazon also drop more than 95% in 2001 ? Brave to hold onto that one at the time.0 -
You want lower numbers for these things. They all infer the price you pay for some reflection of the asset quality. The less you are able to pay the better the investment case.Sea_Shell said:Good Afternoon all.
I have a question. Sorry if it's a rookie one. Take the following funds factsheet...
Rathbone Global Opportunities Fund S Acc Portfolio Overview | GB00BH0P2M97 | Fidelity
What do all the figures under the "Valuation" heading actually mean or represent??
Price/Earnings
Price/Sales
Price/Book
Price/Cash Flow
Are high numbers good or bad? Are they a percentage, if so what of?
They are all higher than the benchmark...is this good?
The rest of the information seems fairly self explanatory, but I've never understood these figures.
(Which I should really, as we've got 6 figures with them!!!!! )
)
But low does not mean a specific number and it is not straight forward to compare two companies with these ratios. For example Imperial Brands has a Price/Earnings ratio of 5 currently, whereas Unilever has a PE ratio of 22. Is Imperial Brands a better deal than Unilever? Impossible to say because it's a completely different industry with a different business case and different future prospects. It might be cheaper today, but those ratios can rapidly change. Imperial Brands are in an industry that could well be further regulated over the next decade which impacts their earnings and pushes up their PE ratio.
All these metrics are backwards looking and value a business with hindsight. That gives you precious little to make an informed choice about whether the future investment case is worthwhile.1 -
Well, we've bitten the bullet and stuck another £15k in. Only time will tell if this was the right choice or not!!!
It was what we'd already decided to do, before I started querying what the numbers meant.How's it going, AKA, Nutwatch? - 12 month spends to date = 3.24% of current retirement "pot" (as at end December 2025)1 -
Just the one fund. Rather than spreading your money over 2 or 3?Sea_Shell said:Well, we've bitten the bullet and stuck another £15k in. Only time will tell if this was the right choice or not!!!
It was what we'd already decided to do, before I started querying what the numbers meant.0 -
Thrugelmir said:
Just the one fund. Rather than spreading your money over 2 or 3?Sea_Shell said:Well, we've bitten the bullet and stuck another £15k in. Only time will tell if this was the right choice or not!!!
It was what we'd already decided to do, before I started querying what the numbers meant.
We are still contributing to our pensions, and we have another ISA fund at lower equity level, plus cash.
This keeps us at roughly a 60% equity allocation, across our whole pot.
So it's not a case of all eggs in one basket.How's it going, AKA, Nutwatch? - 12 month spends to date = 3.24% of current retirement "pot" (as at end December 2025)1









Confirm your email address to Create Threads and Reply

Categories
- All Categories
- 354.6K Banking & Borrowing
- 254.5K Reduce Debt & Boost Income
- 455.5K Spending & Discounts
- 247.5K Work, Benefits & Business
- 604.4K Mortgages, Homes & Bills
- 178.6K Life & Family
- 261.9K Travel & Transport
- 1.5M Hobbies & Leisure
- 16.1K Discuss & Feedback
- 37.7K Read-Only Boards