We’d like to remind Forumites to please avoid political debate on the Forum.
This is to keep it a safe and useful space for MoneySaving discussions. Threads that are – or become – political in nature may be removed in line with the Forum’s rules. Thank you for your understanding.
📨 Have you signed up to the Forum's new Email Digest yet? Get a selection of trending threads sent straight to your inbox daily, weekly or monthly!
The Forum now has a brand new text editor, adding a bunch of handy features to use when creating posts. Read more in our how-to guide
Shortest time to invest in shares
Comments
-
Some people buy shares that pay good dividends, not something I pay much attention to when buying shares.But I am guessing that on average the dividend income from shares would be higher than some savings accounts?1
-
Yes currently average dividends from shares is better than what you can from savings accounts. But if the share price falls by more than the dividend then you have not really earned anything.sevenhills said:Some people buy shares that pay good dividends, not something I pay much attention to when buying shares.But I am guessing that on average the dividend income from shares would be higher than some savings accounts?0 -
It's been a long week so I'm probably missing the obvious but why does the probability drop between years 8-10.5?eskbanker said:
....and here it is (sourced from https://www.nutmeg.com/nutmegonomics/increasing-your-chances-of-positive-portfolio-returns-the-facts-about-long-term-investing/ with the dataset specified below the chart):MaxiRobriguez said:
Someone will be along to put the chart on soon enough but I think year 1 was more like 55%, with 75% only occurring until years 3 or 4.waveydavey48 said:I remember seeing a graph on a post on here with the chance in percentage terms of making any profit on shares for various timescales. If I recall correctly it was the case over the last hundred years or so that 75% of the time you would make a profit after 1 year and the chances improved as time went on.
I can't remember any more and the usual caveats apply of course.
Depends how brave/foolhardy you are I suppose.
Source: Macrobond; MSCI World Equity Mid and MSCI Large Cap Total Return in GBP, 1 January 1971-20 May 20200 -
It's not really genuine probability as such but a retrospective analysis of a specific dataset, so it's effectively saying that there was an increase in 95% of the 8 year periods studied but only 92% of the 10.5 year periods in the same dataset. If they chose a forty year period rather than fifty, or different indices, the results would probably look a bit different, so best not to put too much faith in them at that level of detail, but having said that, it might be reflective of the average historical duration of economic cycles....Bobziz said:
It's been a long week so I'm probably missing the obvious but why does the probability drop between years 8-10.5?eskbanker said:
....and here it is (sourced from https://www.nutmeg.com/nutmegonomics/increasing-your-chances-of-positive-portfolio-returns-the-facts-about-long-term-investing/ with the dataset specified below the chart):MaxiRobriguez said:
Someone will be along to put the chart on soon enough but I think year 1 was more like 55%, with 75% only occurring until years 3 or 4.waveydavey48 said:I remember seeing a graph on a post on here with the chance in percentage terms of making any profit on shares for various timescales. If I recall correctly it was the case over the last hundred years or so that 75% of the time you would make a profit after 1 year and the chances improved as time went on.
I can't remember any more and the usual caveats apply of course.
Depends how brave/foolhardy you are I suppose.
Source: Macrobond; MSCI World Equity Mid and MSCI Large Cap Total Return in GBP, 1 January 1971-20 May 20201 -
The overall message is that for holding for any given couple of months over that almost 50-year period that they looked at, you were only a bit more likely to make a gain rather than a loss (65%) but if you hold for ages you are much more likely to get the 'long term' expectation of a positive result that we all hope for. Almost all of the 13 year periods they looked at gave a positive return. From that then, 'longer hold is better' as a general rule.Bobziz said:
It's been a long week so I'm probably missing the obvious but why does the probability drop between years 8-10.5?eskbanker said:
....and here it is (sourced from https://www.nutmeg.com/nutmegonomics/increasing-your-chances-of-positive-portfolio-returns-the-facts-about-long-term-investing/ with the dataset specified below the chart):MaxiRobriguez said:
Someone will be along to put the chart on soon enough but I think year 1 was more like 55%, with 75% only occurring until years 3 or 4.waveydavey48 said:I remember seeing a graph on a post on here with the chance in percentage terms of making any profit on shares for various timescales. If I recall correctly it was the case over the last hundred years or so that 75% of the time you would make a profit after 1 year and the chances improved as time went on.
I can't remember any more and the usual caveats apply of course.
Depends how brave/foolhardy you are I suppose.
Source: Macrobond; MSCI World Equity Mid and MSCI Large Cap Total Return in GBP, 1 January 1971-20 May 2020
There is nothing special about years 8 to 10.5 and you shouldn't expect that period to be especially bad. However, if they're reporting the stats, they can only say what they see. Markets go up and down in a somewhat haphazard way. It just so happens that out of all the 10.5 year periods they looked at, only about 93% were positive, whereas when they had looked at all the 8 year periods or 11.5 year periods, 95% of them were positive. It just means that for the given set of data, a 10.5 year period was a slightly unlucky amount of time to be holding.
Generally, you still made money. But for example a few times you might have lost money in certain markets: maybe at the end of 1998 or start of 1999 we were at a reasonably high point, entering the last year of a nice big bull cycle (which ended with the dotcom bubble bursting) and after crashing down from that, we had started to recover again but then the global financial crisis / credit crunch took hold in late 2007 and by early summer 2009 we were still in a bad place after that second crash. So a 10.5 year hold period from end of 1998 wouldn't have been great and you might not have got a good positive return in some markets. Whereas an 8 year hold period with the same start point was fine (because at the end of 2007 markets hadn't started to properly plummet yet), and also an 11.5 year hold period was fine because you'd had a year more recovery after the market low of 2009.
If you keep having a bunch of crashes of varying size exactly 10 years apart, big crash then small crash then big then small etc... a 9 year hold means you only see one of those crashes ; roll the dice on where exactly your 9-yr timeframe starts and stops and sometimes you will get the mild crash and sometimes the heavy one, and if you only got the milder one you may still get a positive result. But with an 11 year hold you will be going from pre- the first crash to post- the second crash, and so you will have definitely caught a big crash however you cut the data. So maybe that gives you a lower chance of a positive result, even though we say holding for a long term should get you closer to your goal of seeing all the market conditions and spending time in positive markets.
Of course, we don't know that there will definitely be crashes exactly x years apart. We know we will see some if we hold long enough. Overall we try to hold long enough that the annoying 'noise' of crashes every so often is dwarfed by the total amount we go up.1 -
Thanks both, that makes sense. Do market cycles play any role ? There doesn't seem to be any agreement on where a cycle starts and ends. I read recently that we've been through an entire market cycle in the space of a year, alternatively, we've just started a new cycle. Entirely different subject I guess.0
-
In my experience you've got to go with the 10 + years in the market just in case you get caught out with the big one. I was caught years ago by two about 15 years apart.Bobziz said:Thanks both, that makes sense. Do market cycles play any role ? There doesn't seem to be any agreement on where a cycle starts and ends. I read recently that we've been through an entire market cycle in the space of a year, alternatively, we've just started a new cycle. Entirely different subject I guess.
How the S&P 500 Performed During Major Market Crashes (visualcapitalist.com)
There's been four periods of little or no returns.
EhCv7GqUwAACMF8 (900×504) (twimg.com)
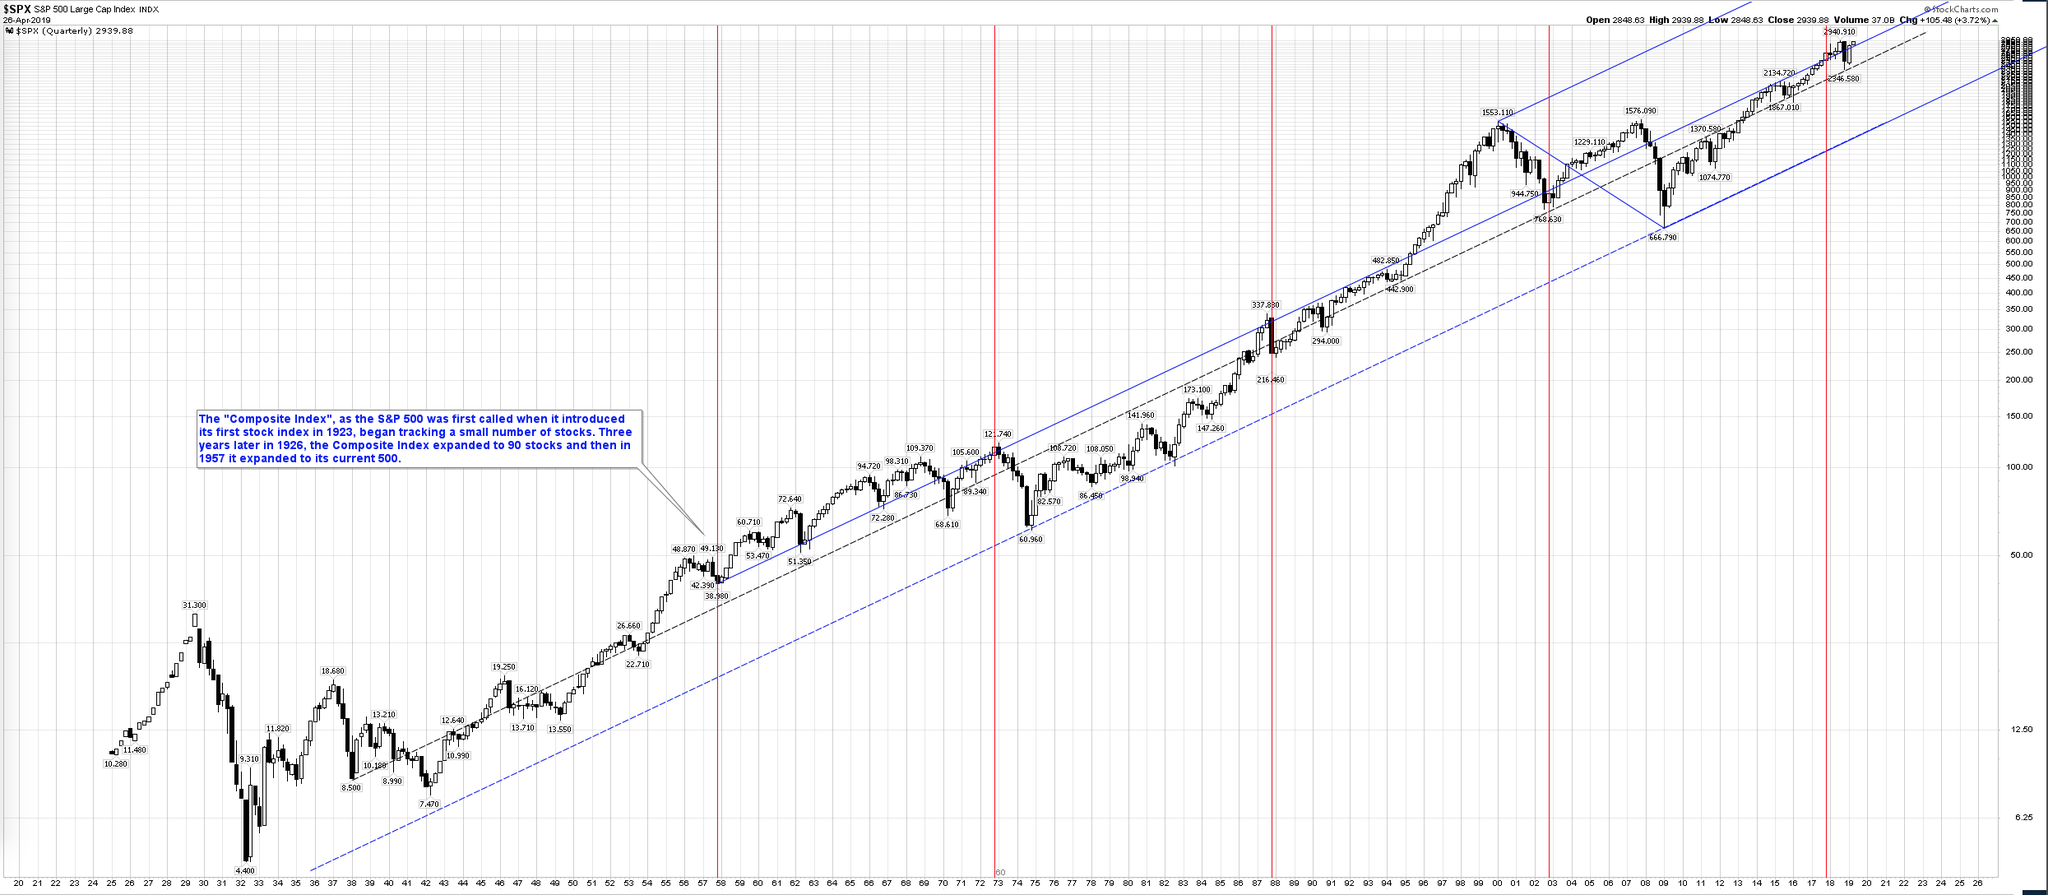
Regarding the start of bull cycles it depends who you listen to. Take 2008 the low was 666 on the SP 500 so that could be called the start. Then others will say starting point was year 2013 when the market regained the losses from the year 2000 when the SP 500 stood at 1553.
D5LIgUqW0AU8hsB.png:large (2048×895) (twimg.com)
1 -
The reality is that everything involves risk.
If you keep your money in savings accounts, you are taking the risk of inflation eroding it.
If you invest in shares, there is a risk that they may go up and down over time.
As the nutmeg graph demonstrates, over a 5 year period, there is about a 88% chance of making a profit and a 12% chance of making a loss. Furthermore, the "average" return generated by the stock markets over the last 10 years (and indeed over the last 50 years) is 7.5% per year.
To me, it is a complete no brainer that, over 5 years, the "reward" of shares vastly, vastly outweighs the "risk".
Also take into account the fact that you want to make mortgage overpayments. That is a conservative, low risk, low return wealth building strategy - so you might wish to take a bit more risk with your other funds.
By the way - why are you making mortgage overpayments? As long as you are able to clear the mortgage before retirement, it is could be a much better idea to maximise your pension contributions and stocks & shares ISA contributions, rather than making mortgage overpayments. Especially if you are a higher rate tax payer.
0 -
Without including dividends, it's not a study of reality. In the past 25 years of the FTSE 12 years is the longest period without any profit and that does not include dividends.eskbanker said:It's not really genuine probability as such but a retrospective analysis of a specific dataset, so it's effectively saying that there was an increase in 95% of the 8 year periods studied but only 92% of the 10.5 year periods in the same dataset.
0 -
The graph doesn't actually demonstrate anything about chance or probability as such, it's just an analysis of selected historical data over a specific time period. It also has no recognition of quantum, i.e. it's a simplistic view of whether a portfolio is up or down, without any measure of how much it's moved by, so any assessment of risk versus reward needs to factor that in....steampowered said:As the nutmeg graph demonstrates, over a 5 year period, there is about a 88% chance of making a profit and a 12% chance of making a loss. Furthermore, the "average" return generated by the stock markets over the last 10 years (and indeed over the last 50 years) is 7.5% per year.
To me, it is a complete no brainer that, over 5 years, the "reward" of shares vastly, vastly outweighs the "risk".
If you're suggesting that it doesn't include dividends, what support do you cite for that? I don't see any definitive reference one way or the other but the dataset is labelled as 'total return' which does normally imply inclusion of reinvested dividends.... Not sure why you're citing 25 years of a UK index, in the context of a study evaluating global ones over 50 years?sevenhills said:
Without including dividends, it's not a study of reality. In the past 25 years of the FTSE 12 years is the longest period without any profit and that does not include dividends.eskbanker said:It's not really genuine probability as such but a retrospective analysis of a specific dataset, so it's effectively saying that there was an increase in 95% of the 8 year periods studied but only 92% of the 10.5 year periods in the same dataset.5


Confirm your email address to Create Threads and Reply

Categories
- All Categories
- 354.6K Banking & Borrowing
- 254.5K Reduce Debt & Boost Income
- 455.5K Spending & Discounts
- 247.5K Work, Benefits & Business
- 604.4K Mortgages, Homes & Bills
- 178.6K Life & Family
- 261.9K Travel & Transport
- 1.5M Hobbies & Leisure
- 16.1K Discuss & Feedback
- 37.7K Read-Only Boards