We’d like to remind Forumites to please avoid political debate on the Forum.
This is to keep it a safe and useful space for MoneySaving discussions. Threads that are – or become – political in nature may be removed in line with the Forum’s rules. Thank you for your understanding.
📨 Have you signed up to the Forum's new Email Digest yet? Get a selection of trending threads sent straight to your inbox daily, weekly or monthly!
The Forum now has a brand new text editor, adding a bunch of handy features to use when creating posts. Read more in our how-to guide
Understanding investment gains/losses

neildt
Posts: 59 Forumite


Can anyone offer some guidance on understanding investment gains and losses and how they are calculated? I use both HL to invest in funds, and recently the FreeTrade app. to buy individual stocks.
From what I've read, FreeTrade calculates the gain/loss based on first in first out the calculation, but HL uses an average weighted price?
For example, with FreeTrade I have invested in BP on the following dates, with two sales on the 18th May and with speculative sell using the 15th June 2020 price of £3.16 if I were to sell my entire holding.

Here is the FreeTrade snapshot

How come my gain is -£1.79 yet FreeTrade shows £4.46.
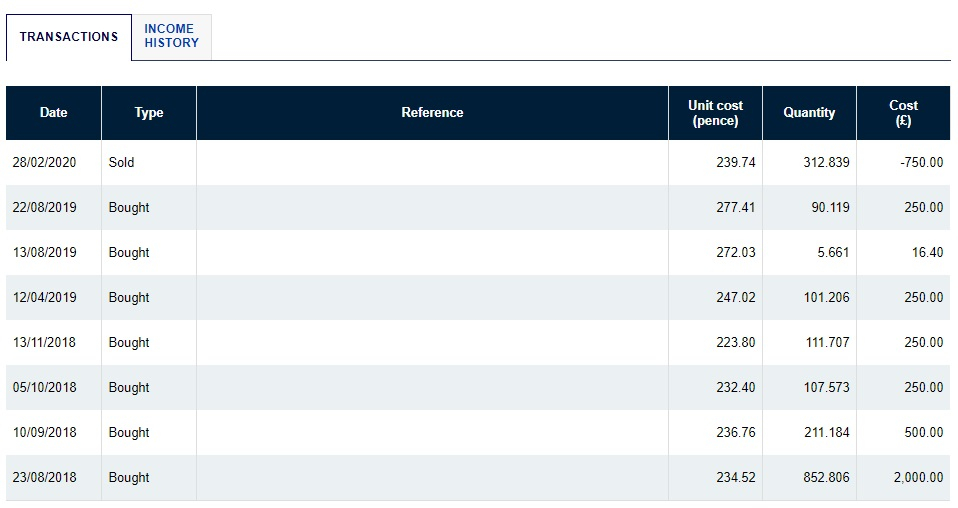
If I compare this with HL, where I have invested in a fund since 23rd August 2018, but sold out 312.839 units on 28th February 2020.
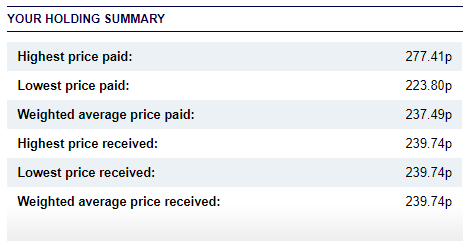
My weighted prices are
My current gain is as follows, which if I calculate manually works out correctly.
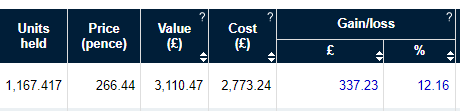
It seems HL is showing the correct gain/loss using the average weighted price, and taking into consideration my sell, but I'm struggling with FreeTrade's calculation, and if I were to just use FreeTrade's gain/loss I could be selling at a loss even though the app is showing a gain.
From what I've read, FreeTrade calculates the gain/loss based on first in first out the calculation, but HL uses an average weighted price?
For example, with FreeTrade I have invested in BP on the following dates, with two sales on the 18th May and with speculative sell using the 15th June 2020 price of £3.16 if I were to sell my entire holding.
Here is the FreeTrade snapshot
How come my gain is -£1.79 yet FreeTrade shows £4.46.
If I compare this with HL, where I have invested in a fund since 23rd August 2018, but sold out 312.839 units on 28th February 2020.
My weighted prices are
My current gain is as follows, which if I calculate manually works out correctly.
It seems HL is showing the correct gain/loss using the average weighted price, and taking into consideration my sell, but I'm struggling with FreeTrade's calculation, and if I were to just use FreeTrade's gain/loss I could be selling at a loss even though the app is showing a gain.
0
Comments
-
You seem to be thinking similar things to me. (See my post about costs and growth).(Nearly) dunroving0
-
Freetrade's calculation is somewhat garbage and is a simplistic measure which is not intended to be useful for anything - such as UK tax reporting where your cost includes stamp duties and every trade is matched with other specific trades or pool averages according to a rulebook.
To 'prove' Freetrade's useless number:
They say if you sell at current value and get proceeds of 319.16 you would make a 'profit' of 4.46, so they must think the cost of your current holdings is £314.70
They have got to this figure by doing a LIFO (last in, first out) calculation looking at your whole history for this stock.
This causes them to imagine that when you sold 47 shares on 18 May, the shares you sold were :
(a) the 7 shares bought on 28 May (by coincidence rather than design, this is similar to what is needed per HMRC matching rules, where for CGT purposes if you buy back shares within 30 days of selling them, the disposal is matched to that later purchase rather than to your historic carrying cost);
(b) the other most recent 40 shares you had purchased, being the second batch of 5 May, ignoring all the other shares you held.
This means the shares they think have not been sold are are counting in your cost are:46 shares bought at 3.215= 147.8933 shares bought at 3.01 = 99.332 shares bought at 3.00 = 612 shares bought at 3.077 = 36.928 shares bought at 3.07 = 24.56total is 101 shares for a cost of 314.70
The difference between that carrying cost of 314.70 and the 319.16 is the 'profit' of 4.46 they say you would make at current value. But it ignores stamp duty - which is a true cost of purchase and allowable by the tax man, and anecdotally Freetrade's calc also includes FX commissions if the shares were bought in foreign currency. And the basis on which they have done it is assuming your oldest shares are the ones you still hold (i.e. the last ones bought are first out when sold, LIFO basis rather than FIFO). That's not a popular method or acceptable for tax purposes if you're doing this in an unwrapped account - not that there are going to be any capital gains taxes when dealing with a few hundred pounds, it's all covered by your annual exemption.
A more sensible performance measure, if not following the specific HMRC rules (which most providers don't attempt to bother with, because they don't know if you hold any other BP shares elsewhere...) would use an average cost method for the pool of shares held that haven't been sold, which is probably what HL does.
So you'd have bought the 46 shares and the 33 shares and the 2 shares etc etc until you had 141 shares at some average cost, then you would have sold 47 of them without the average cost changing, leaving 94 shares; then you would have added 7 shares changing the average cost.
It's what most people would do for simplicity although that is still not allowable for tax purposes with your particular pattern of activity because of the quirky HMRC rule about share repurchases designed to stop you cashing in shares for a massive gain or loss near the end of a tax year and then buying them back again quickly afterwards. The HMRC rule would mean the last 7 shares bought on 28 May would be matched against 7 of the 47 shares sold on 18 May, and only the other 40 shares sold on 18 May would have been considered 'sold' from the average pool of 141 which had been held going into 18 May.
1 -
Thanks bowlhead99. The HL calculation is showing exactly what I expect with the gain/loss taking into consideration all of my previous buys/sells. So if I sell more of this fund the gain/loss will be reflected based on the average weighted price of my current pool of units?
However, my concern with FreeTrade's figure is that it's misleading and people could easily sell out a position at a loss as this value isn't the true gain/loss of the overall investment.
0 -
Well, the number wouldn't be useful for my purposes but one can argue it's not really misleading - there are a number of ways to record unrealised performance but they will differ to some extent depending on whether you want to include all types of incidental related costs (e.g. stamp duties, commissions) or are just considering the actual change in price since you bought it, and how you want to match partial sales of your position to historic purchases (e.g. FIFO, LIFO, average, HMRC rules etc). Some jurisdictions such as the US will allow you to elect to use one basis or another for tax purposes as long as you are consistent for your pool of covered shares. Freetrade plan to expand their services across Europe and it's likely not all countries mandate the same method.
If you take an example where a share price was generally rising over the course of a long holding period - if Freetrade consider that your sales will come first from the shares you have most recently bought (which will generally be at a higher price than those you've held for longer), then by comparison to the 'average cost' method you would be understating the profit in what you have just sold, and overstating the potential profit remaining in what you have not yet sold. Perhaps that is a better / more conservative way round for some people than thinking they have sold all their old cheap shares and made huge profits while the new shares they bought last month have not really gone anywhere. The person using an average or FIFO method would say he is banking nice big profits which isn't necessarily true if he is bringing new unsold shares into his portfolio at high prices while claiming to have made a nice profit.
A sensible investor should not sell 101 shares of BP merely because a broker's methodology says that if he sells today he will cash-out some potential upside from some historic sunk cost... he should sell them because he has looked at his portfolio and considered the risks, potential rewards and current valuation of the 101 BP shares and decided whether the 101 BP shares are useful to hold within the portfolio. How he chooses to 'keep score' is up to him.
0


Confirm your email address to Create Threads and Reply

Categories
- All Categories
- 354.4K Banking & Borrowing
- 254.4K Reduce Debt & Boost Income
- 455.4K Spending & Discounts
- 247.3K Work, Benefits & Business
- 604K Mortgages, Homes & Bills
- 178.4K Life & Family
- 261.5K Travel & Transport
- 1.5M Hobbies & Leisure
- 16K Discuss & Feedback
- 37.7K Read-Only Boards