We’d like to remind Forumites to please avoid political debate on the Forum.
This is to keep it a safe and useful space for MoneySaving discussions. Threads that are – or become – political in nature may be removed in line with the Forum’s rules. Thank you for your understanding.
📨 Have you signed up to the Forum's new Email Digest yet? Get a selection of trending threads sent straight to your inbox daily, weekly or monthly!
The Forum now has a brand new text editor, adding a bunch of handy features to use when creating posts. Read more in our how-to guide
Bipolar Graph

Terrysdelight
Posts: 1,202 Forumite


in Techie Stuff
Hi
School homework!!
Can anyone tell me how/where I can learn to do a 'Bipolar Graph'. I'm guessing it should be in Excel but I've had a look and can't find anything.
Many thanks
Terrysdelight
School homework!!
Can anyone tell me how/where I can learn to do a 'Bipolar Graph'. I'm guessing it should be in Excel but I've had a look and can't find anything.
Many thanks
Terrysdelight
0
Comments
-
Is it not just a usual column or bar chart?0
-
Is it not just a usual column or bar chart?
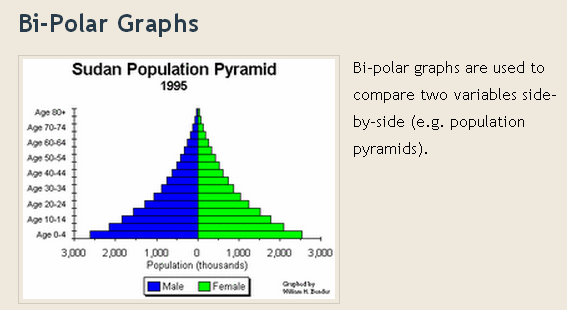
I've been looking at various images on line and yes, examples do include columns and bars - both above the line and below the line (positive and negative - up and down, so I guess this is why it's called bipolar).
We need to know how to record the data in excel - then I guess it will just be a case of highlighting text and the graph/wizard will do the rest?0 -
or side by side
 0
0 -
Try doing this as two series: one for positive numbers and another for negative.0
-
I've found the graphs, but I'm just now sure how he should be recording his data in the spreadsheet.
It's a ruddy environmental study with 15 questions and a range of 5 answers.0 -
Finally worked it out. Son wasn't recording data correct. Once he changed data to positive and negative numbers, the bars, went up and down as they should.
Phew.....0


This discussion has been closed.
Confirm your email address to Create Threads and Reply

Categories
- All Categories
- 353.5K Banking & Borrowing
- 254.1K Reduce Debt & Boost Income
- 455K Spending & Discounts
- 246.6K Work, Benefits & Business
- 602.9K Mortgages, Homes & Bills
- 178K Life & Family
- 260.5K Travel & Transport
- 1.5M Hobbies & Leisure
- 16K Discuss & Feedback
- 37.7K Read-Only Boards