We’d like to remind Forumites to please avoid political debate on the Forum.
This is to keep it a safe and useful space for MoneySaving discussions. Threads that are – or become – political in nature may be removed in line with the Forum’s rules. Thank you for your understanding.
Debate House Prices
In order to help keep the Forum a useful, safe and friendly place for our users, discussions around non MoneySaving matters are no longer permitted. This includes wider debates about general house prices, the economy and politics. As a result, we have taken the decision to keep this board permanently closed, but it remains viewable for users who may find some useful information in it. Thank you for your understanding.
📨 Have you signed up to the Forum's new Email Digest yet? Get a selection of trending threads sent straight to your inbox daily, weekly or monthly!
The Forum now has a brand new text editor, adding a bunch of handy features to use when creating posts. Read more in our how-to guide
Young hit hardest in recession
Comments
-
mystic_trev wrote: »Who'd want to be young again?
Certainly not me!
http://www.ftadviser.com/2014/07/15/pensions/sipps/people-are-years-behind-in-pension-saving-liberty-4ClRidINFKw8Lh4jECRQrM/article.html
£208 per YEAR? No wonder! I pay nearly double that in per month...
Why didn't they just go the whole hog and say that they'd need to have been born in 1750 paying £1 per month. What a ridiculous article.0 -
.
The people I worry for are all these poor suckers born in the 1960s that actually think that working for 30 years and paying little or nothing in to a pension is going to provide for a rich, well paid retirement for a further 30+ years. Generation X already outnumbers the Boomers. Once Generation Y start voting in serious numbers, the Boomers are likely to find the plug pulled on all their unlikely perks.
I agree that those born in the 1960s paying little or nothing for their pensions are in for a shock. Many of that generation entered employment when pensions were still available for the people in professional or skilled jobs who did not think too closely about pensions. Of course there were always those in lower paid jobs that could not afford a decent pension.
But what we have seen over that timeframe is a proliferation of, low paid work, self employment and now zero hours contracts. Many that chose self employment did invest in a pension, but many never bothered. Those who stumbled into self employment ( as the solution to redundancy) were ill prepared for making pension provision.
.Few people are capable of expressing with equanimity opinions which differ from the prejudices of their social environment. Most people are incapable of forming such opinions.0 -
Which versions of the Family Expenditure Survey and Family Resources Survey did you use, being the person claiming to be the author of this otherwise unsourced image?the_flying_pig wrote: »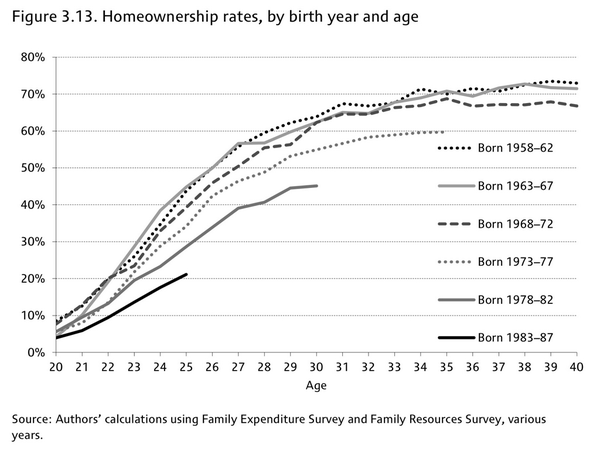
The difference in home ownership rates was caused in large part by government action. A government introduced assured tenancies for life. Naturally those were unpopular with landlords and over a few years that caused the percentage of the housing stock that was let to drop by about half. That started to recover after assured shorthold tenancies were introduced by the Housing Act of 1988 and today the percentage of let properties is around what it was before the assured tenancies were introduced.
So those with a birth date prior to 1968 were forced into buying and those born later than that saw a gradual increase in the availability of the rental alternative.
The graph you have provided is a great illustration of the potential effect of policy on the choices that people can make, showing as it does the tight initial rental supply then the improvement for those born in 1978-82 and more so for those born from 1983-87 when supply had become closer to the historic level again.0 -
Which versions of the Family Expenditure Survey and Family Resources Survey did you use, being the person claiming to be the author of this otherwise unsourced image?....
i think it was retweeted by ed conway or someone like that, not sure of the original source [i think maybe an economist at UCL or something] but as the rest of your post seems to indicate, the results looks massively unsurprising....
The difference in home ownership rates was caused in large part by government action. A government introduced assured tenancies for life. Naturally those were unpopular with landlords and over a few years that caused the percentage of the housing stock that was let to drop by about half. That started to recover after assured shorthold tenancies were introduced by the Housing Act of 1988 and today the percentage of let properties is around what it was before the assured tenancies were introduced.
So those with a birth date prior to 1968 were forced into buying and those born later than that saw a gradual increase in the availability of the rental alternative.
The graph you have provided is a great illustration of the potential effect of policy on the choices that people can make, showing as it does the tight initial rental supply then the improvement for those born in 1978-82 and more so for those born from 1983-87 when supply had become closer to the historic level again.
i agree with all of that except for the highlighted bit - you've devoted three paragraphs to discussing something that's not nothing but equally aren't first or even second order explanations, just stuff at the very peripharyFACT.0 -
You may disagree but the change in tenant law is why landlords started withdrawing their properties from the rental market and why a fix for that was made in 1988. Lower property supply inevitably drove increased buying demand and higher home ownership, even when not the best choice.
For the later two groups there is a choice about buying, so there's less pressure to buy even when it's a bad choice. More driven buy the underlying demand to buy based on appropriateness and affordability, with affordability an issue that's been growing.0


This discussion has been closed.
Confirm your email address to Create Threads and Reply

Categories
- All Categories
- 354.3K Banking & Borrowing
- 254.4K Reduce Debt & Boost Income
- 455.4K Spending & Discounts
- 247.3K Work, Benefits & Business
- 604K Mortgages, Homes & Bills
- 178.4K Life & Family
- 261.5K Travel & Transport
- 1.5M Hobbies & Leisure
- 16K Discuss & Feedback
- 37.7K Read-Only Boards