We’d like to remind Forumites to please avoid political debate on the Forum.
This is to keep it a safe and useful space for MoneySaving discussions. Threads that are – or become – political in nature may be removed in line with the Forum’s rules. Thank you for your understanding.
📨 Have you signed up to the Forum's new Email Digest yet? Get a selection of trending threads sent straight to your inbox daily, weekly or monthly!
The Forum now has a brand new text editor, adding a bunch of handy features to use when creating posts. Read more in our how-to guide
Energy myth-busting: Is it cheaper to have heating on all day?
Comments
-
This image shows my living room temperature vs 15 minute average gas use, the radiators in this room do not have TRVs because the thermostat is also in this room, all other rooms aside from the bathroom have TRVs, this shows the relationship between boiler output and temperature increase.
Total use for today was 39kWh.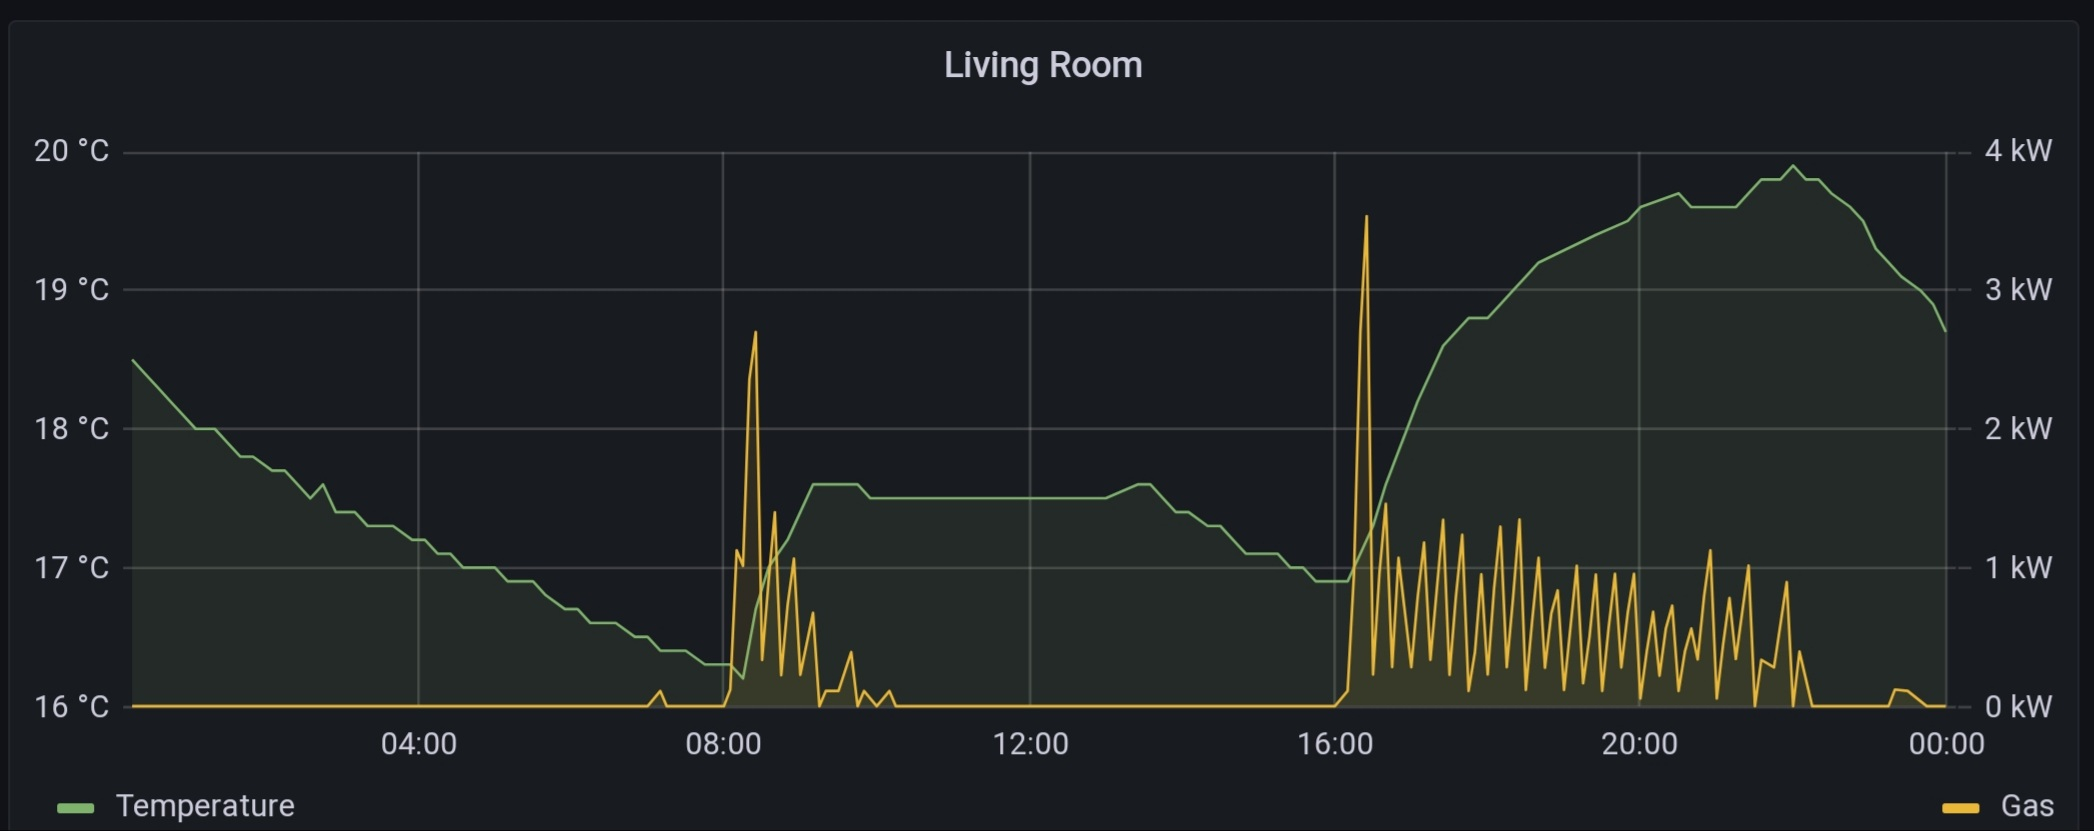
4.29kWp Solar system, 45/55 South/West split in cloudy rainy Cumbria.1 -
The yellow trace is presumably kWh?
0 -
@Spies
That's a very interesting graph. Is that purely for the heating? Any hot water in there?
We used 44kwh of gas yesterday (no fancy charts available Just the IHD reading.) but that does also include our hot water, which uses about 6kwh, once a day. How's it going, AKA, Nutwatch? - 12 month spends to date = 3.24% of current retirement "pot" (as at end December 2025)0
 -
Yes it's general gas usage, so includes the hob and hot water (on demand), but we didn't use the hob yesterday and we didn't have a bath or shower so it's fairly accurate.Sea_Shell said:@Spies
That's a very interesting graph. Is that purely for the heating? Any hot water in there?
We used 44kwh of gas yesterday (no fancy charts available Just the IHD reading.) but that does also include our hot water, which uses about 6kwh, once a day.
Yes the yellow line is kWh.4.29kWp Solar system, 45/55 South/West split in cloudy rainy Cumbria.1 -
Spies
what are you using to monitor your usage ?
That looks very interesting.
0 -
Really interesting but in assessing the limited context of the question, the significant bias of personal choice does not get assessed. Clearly it is cheaper not to have any heating on. Is this acceptable to most? No. So the query comes back to what you are willing to pay for the comfort you want and how best exploit the system you have. Some on here have taken time and effort to understand their own systems, how they respond, their lifestyle and the underlying data. As such they will optimise the performance to meet their own needs. Others want big handfuls that sort of gets them in the right area.Spies said:This image shows my living room temperature vs 15 minute average gas use, the radiators in this room do not have TRVs because the thermostat is also in this room, all other rooms aside from the bathroom have TRVs, this shows the relationship between boiler output and temperature increase.
Total use for today was 39kWh.
@spies
What is your system set up please, as well as house size and level of insulation?
Do you have a graph with your heating set back to 17.5 deg c from 22:00 to 16:00 to see demonstrate the variance from 39kWh?
Do you feel the benefit for pushing the energy into the system after 20:00 obviously it gives a higher start point for the overnight decay but maybe achieving 19 deg c by 20:00 and then setting back to sustain at 17.5 might smooth the curves.
Your life is too short to be unhappy 5 days a week in exchange for 2 days of freedom!1 -
I live in a 2 bedroom house, built in 1996.
I have a total of 3 radiators downstairs (kitchen and hallway) set to 3 on the TRV, then one in each of the bedrooms set to 3, the bathroom radiator is small with no TRV and the front room has 2 large radiators with no TRV.
I have little to no wall insulation because one wall suffored badly with damp so it all had to be removed from that side, I don't have much insulation in the loft, doesn't seem very thick anyway, the living room is double height with a mezzanine and no loft, cars drive underneath to the car park behind so it's open to the outside air underneath the floor too.
The target for the periods of heat varies depending on weekday or weekend.
I've set the stat to 17.5c for 10pm tonight until 4pm tomorrow so I'll post back once I have that data.
Might have to wait until Monday for a direct comparison as that data was taken from a weekday.4.29kWp Solar system, 45/55 South/West split in cloudy rainy Cumbria.1 -
Home assistant then the data is piped into grafana.Heinzbean said:Spies
what are you using to monitor your usage ?
That looks very interesting.
Hardware wise I'm using a zigbee window sensor taped to the front of my gas meter which detects the magnet on the first digit, then various calculations to figure out what's been used.4.29kWp Solar system, 45/55 South/West split in cloudy rainy Cumbria.1 -
SpiesI was playing with a Libre office Calc. and can create simple things like these.This graph shows my Gas cf3 for 2020/2021 The blue is 2020 before i had an insulated double glazed house. I used to just manually switch the heating on and off from the thermostat. The red is (2021)where i was using the thermostat to heat the house to 18"
 1
1 -
have you also adjusted for the different weather in 20 & 21 (i.e. normalised the data)?1


Confirm your email address to Create Threads and Reply

Categories
- All Categories
- 354.6K Banking & Borrowing
- 254.5K Reduce Debt & Boost Income
- 455.5K Spending & Discounts
- 247.5K Work, Benefits & Business
- 604.4K Mortgages, Homes & Bills
- 178.6K Life & Family
- 261.9K Travel & Transport
- 1.5M Hobbies & Leisure
- 16.1K Discuss & Feedback
- 37.7K Read-Only Boards