We’d like to remind Forumites to please avoid political debate on the Forum.
This is to keep it a safe and useful space for MoneySaving discussions. Threads that are – or become – political in nature may be removed in line with the Forum’s rules. Thank you for your understanding.
📨 Have you signed up to the Forum's new Email Digest yet? Get a selection of trending threads sent straight to your inbox daily, weekly or monthly!
The Forum now has a brand new text editor, adding a bunch of handy features to use when creating posts. Read more in our how-to guide
Newton Real Return fund

koru
Posts: 1,546 Forumite


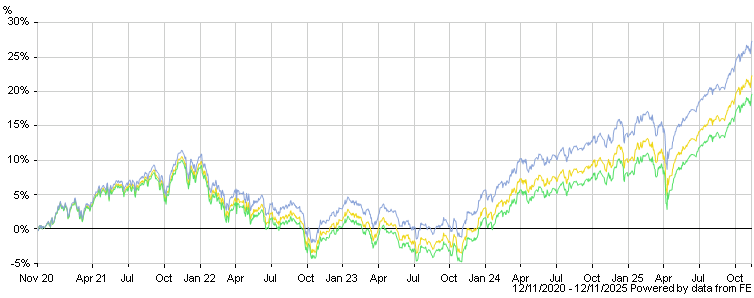
According to Hargreaves Lansdown, the A shares of Newton Real Return fund (which is the one available on most platforms, including HL and Alliance Trust Savings) massively underperform the X shares and the Inst shares. I can understand that there might be classes of the same fund with a lower AMC of perhaps 1.0% or even 0.75%, but this would only explain a small part of the difference in performance, which is between 4.5 and 5.5% per year. The green line in the following chart is the A class and the blue is the X class. The chart shows total return.
Can anyone explain the difference in performance? Or has HL simply got it wrong? If this difference is genuine, are the X class and Inst class only available through advisers or is there another way?
I have noticed that the green line seems to start at about -2%, whereas the other two start at 0%, as you would expect. Therefore, it would appear there is a glitch in the software producing this chart, which makes me wonder whether the rest of the chart is reliable.
koru
0
Comments
-
To answer my own question, according to Morningstar the difference in total return is more like 1.5% per year. So, HL's information is wrong.
Morningstar says the AMC on the X class units is zero, so I assume this is a special class that is only available in situations where Newton gets some other reward.koru0 -
The HL chart has now corrected. (The chart in my first post is a dynamic link, not a snapshot of what I saw when I posted.) It shows a difference of ~1.5% performance per year, which is explained by no AMC. But lesson learned: HL charts are not reliable.koru0
-
Glad I could help.
(:D)0


This discussion has been closed.
Confirm your email address to Create Threads and Reply

Categories
- All Categories
- 354.3K Banking & Borrowing
- 254.4K Reduce Debt & Boost Income
- 455.4K Spending & Discounts
- 247.3K Work, Benefits & Business
- 604K Mortgages, Homes & Bills
- 178.4K Life & Family
- 261.5K Travel & Transport
- 1.5M Hobbies & Leisure
- 16.1K Discuss & Feedback
- 37.7K Read-Only Boards