We’d like to remind Forumites to please avoid political debate on the Forum.
This is to keep it a safe and useful space for MoneySaving discussions. Threads that are – or become – political in nature may be removed in line with the Forum’s rules. Thank you for your understanding.
📨 Have you signed up to the Forum's new Email Digest yet? Get a selection of trending threads sent straight to your inbox daily, weekly or monthly!
'When would you use the geometric mean?' blog discussion.
Comments
-
Or am I just overworked and confused myself!?
Yeah, you're overthinking it. The first way you did it was a good way of approaching the problem - but not the best! Sadly, being a physics teacher, these problems always amuse me (if you're not great at algebra probably best to stop reading).
I'm going to label things with the leg of the journey, so-
t1 = time taken to get there
t2 = time to get back
v1 = speed to get there
v2 = speed back
x = distance to get there
We need to work out the average speed. The average speed is the TOTAL DISTANCE divided by the TOTAL TIME.
in all cases, t = x/v (rearranging v = xt), so we know that
t1 = x/v1
t2 = x/v2
We need to know the overall time. This is the time there added to the time back: t1 + t2. Using the equations above, we know this in terms of distance and velocity..
t1 + t2 = (x/v1) + (x/v2)
This is rather unpleasant, so with some messing around and adding of fractions - I've missed out a lot of steps here! - we can rearrange:
x/(t1 + t2) = (v1 * v2) / (v1 + v2)
This part of the left side of the equation looks a lot like what we need - total distance (2x) divided by total time (t1 + t2). Total distance is actually 2x, so what we can do is multiply both sides by 2..
average speed = 2(v1 * v2) / (v1 + v2)
As you can see, this is nothing like the arithmetic mean. In fact, it's a terrible example, because it's actually what we refer to as the harmonic mean which has different applications to both the arithmetic mean and the geometric mean - one of which is working out an average speed.
Just to confuse you even further, Martin!
wikipedia.org/wiki/Harmonic_mean0 -
psychodave wrote: »Yeah, you're overthinking it. The first way you did it was a good way of approaching the problem - but not the best! Sadly, being a physics teacher, these problems always amuse me (if you're not great at algebra probably best to stop reading).
I'm going to label things with the leg of the journey, so-
t1 = time taken to get there
t2 = time to get back
v1 = speed to get there
v2 = speed back
x = distance to get there
We need to work out the average speed. The average speed is the TOTAL DISTANCE divided by the TOTAL TIME.
in all cases, t = x/v (rearranging v = xt), so we know that
t1 = x/v1
t2 = x/v2
We need to know the overall time. This is the time there added to the time back: t1 + t2. Using the equations above, we know this in terms of distance and velocity..
t1 + t2 = (x/v1) + (x/v2)
This is rather unpleasant, so with some messing around and adding of fractions - I've missed out a lot of steps here! - we can rearrange:
x/(t1 + t2) = (v1 * v2) / (v1 + v2)
This part of the left side of the equation looks a lot like what we need - total distance (2x) divided by total time (t1 + t2). Total distance is actually 2x, so what we can do is multiply both sides by 2..
average speed = 2(v1 * v2) / (v1 + v2)
As you can see, this is nothing like the arithmetic mean. In fact, it's a terrible example, because it's actually what we refer to as the harmonic mean which has different applications to both the arithmetic mean and the geometric mean - one of which is working out an average speed.
Just to confuse you even further, Martin!
wikipedia.org/wiki/Harmonic_mean
Was just about to explain that the speed question is actually a HARMONIC Mean, not a geometric mean, an arithmetic mean, or any other type of average, when psychodave did it for me.
Just to add: the maths psychodave uses is correct, but I like to think of the harmonic mean as the reciprocal of the arithmetic mean of the reciprocals of the data. (For those who are unclear, the reciprocal of x is 1/x)
So for the speed case
the mean speed is 1/((1/2+1/4)/2) = 8/3 = 2.66667
Harmonic mean is used when averaging rates
note that similarly, as pointed out by someone else, the geometric mean is e^(arithmetic mean of the logs of the data), and is used where there is multiplicative growth (such as % year on year)0 -
JimmyTheWig wrote: »Yes, I think you've confused yourself.
It gives average speed for the journey in miles per hour and average fuel consumption (presumably for the journey - that's what ours does) in miles per gallon.
So if you travel 80 miles in 1 hour and use 2 gallons of petrol, you'll get an average speed of 80 mph and an average consumption of 40 mpg.
It's distance based in as much as distance appears in the calculation. It appears in each calculation once.
I dont think I have confused myself. I think, now that other poseters have mentioned the harmonic mean, that my question is more linked to do they use arithmetic or harmonic mean for the average speed and average fuel consuption and why do they choose the one they do.
Anyway to show what I mean, you said 80 miles in 1 hr and 2 gallons of fuel.
Well lets assume your on the motorway and driving at a constant speed over two seperate sections, section 1 you done 40 miles in 20mins and then section 2 you covered 40miles in 40 mins. Total 80miles and 1 hr. for the first leg you do 40m / 1/3hr = 3*40 = 120mph (ok bad example for realism). then you do 40 miles at 40mph which is 40m / 2/3hr = 40*3/2 = 60mph.
So 120mph and 60mph, arithmetic mean is 90mph. But you did one for longer so you need to accountfor that.
So do you divide by the time (1hr) so the 120mph was covered for 1/3 of the time so gets a 1/3 weighting and 2/3 weighting to 60mph. (ie) the average is 80mph. Or do you divide them by the distance and give them an equal weighting as you covered the same miles in both so 50 - 50.
An Average of 80mph with one and 90mph with the other.
As I said somebody who knows about the harmonic mean may be able to explain this further but as agrajag states the harmonic is used for averaging rates which is what I am talking about. So does that mean my car should give me the harmonic mean of the fuel consumption and speed? It would obviouslly be in the car makers interests to make the "average" miles per galon as high as possible so would suggest the geometric mean for their benefits?Here to help and be helped!0 -
Well they have changed the name from RPI to CPI to demonstrate a change and it could be that one is better than the other. After all none of them are right by definition. They are trying to approximate a number that cannot be calculated exactly. They have changed their method to make it a better approximation to the change in prices.
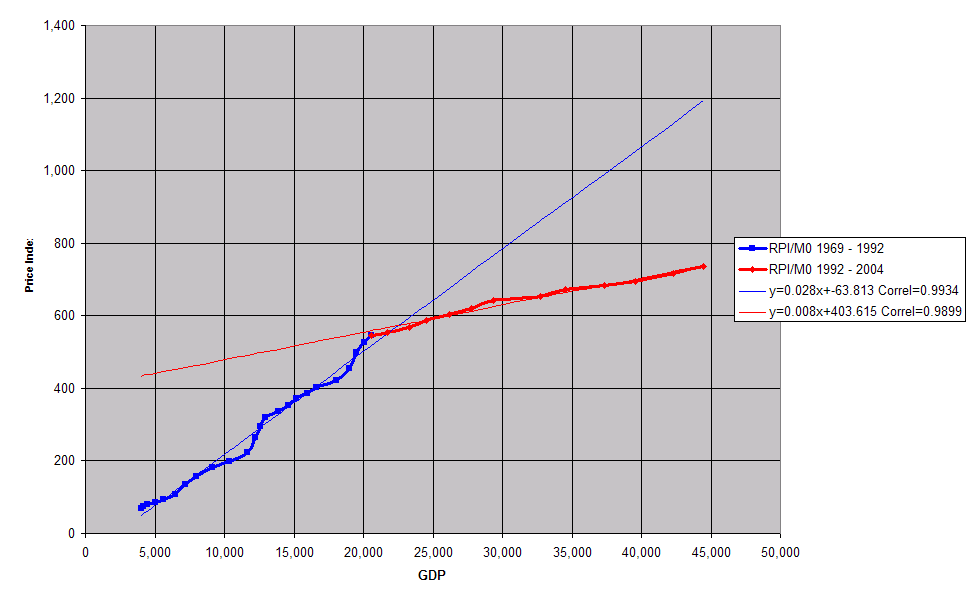
I did a graph a number of years ago, incorporating "the inflation rate" and M0 and other bits and bobs. I did wonder for a while, why there was a step-change.
The change makes changes to the price index seem lower than under the old measure (follow the trend line) - now there's a shocker...Wow - you're rude(!) and you significantly misunderstood my point. I agree that everybody should be made to demonstrate the validity of their methodology but I am questioning whether everybody can understand the response.
No. You said:My degree is in Maths and Stats and I work as a Math teacher but I am comfortable that the guys there use methods that I don't fully understand.]
You weren't questioning whether everyone could understand the response, you were questioning whether *you* could understand the response.
Despite economics being the "dismal science", there is nothing in economics that you, with a reasonable level of maths you have, should not be able to understand.I happen to expect that somebody working at the ONS who has spent their whole career working in statistics has an understanding that is deeper and better than mine and that it might take another statistician with greater knowledge and understanding than me to dialogue with them about the suitability of their approach.
I think a couple of quotes should go in here...
John Kenneth Galbraith: "The study of money, above all other fields in economics, is one in which complexity is used to disguise truth or to evade truth, not to reveal it. Money: Whence it came, where it went - 1975, p15"
And a bit of levity:
Ernest Rutherford: “If your experiment needs statistics, you ought to have done a better experiment.”This is exactly what does go on within the profession. Sometimes I get really bothered that everybody expects to be an expert at everything with just a quick glance over a topic and fully expects to be able to critique a topic they know and understand very little about.
Economics is easy to understand. It's only about people and money, and both of those have been around for quite some time. Even derivatives, the supposed new thing, were first sold during the Greek Empire (which predates the Roman Empire).
Read a few papers off the Bank of England site. The most complex one I've seen used eigenvalues/vectors - which you should know. Most are just prose.
Once you've read a few, enough to get a feel for them, (the one blaming the higher velocity of money on electronic banking was a real side-splitter) then you'll see it's not so hard after all.
And yes, you can (and should) challenge people on it. I've already given the alternative to that."Follow the money!" - Deepthroat (AKA William Mark Felt Sr - Associate Director of the FBI)
"We were born and raised in a summer haze." Adele 'Someone like you.'
"Blowing your mind, 'cause you know what you'll find, when you're looking for things in the sky." OMD 'Julia's Song'0 -
I don't think this has been posted yet, apologies if I missed it... If you are interested in the differences and why they exist then I think the ONS document on arithmetic vs geometric means in CPI/RPI is a "good read"* - see around page 83 in:-
http://www.statistics.gov.uk/downloads/theme_economy/CPI_Technical_manual-2010.pdf
*Disclaimer - bear in mind some of my research was on indices so I am not exactly normal in what constitutes a good read! I'm not an economist, however. And defintely not enough of an expert to contribute something orginal to this thread, sorry.:shhh: There's somewhere you can go and get books to read... for free!
:coffee: Rediscover your local library! _party_0 -
Economics is easy to understand. It's only about people and money, and both of those have been around for quite some time. Even derivatives, the supposed new thing, were first sold during the Greek Empire (which predates the Roman Empire).
Read a few papers off the Bank of England site. The most complex one I've seen used eigenvalues/vectors - which you should know. Most are just prose.
Once you've read a few, enough to get a feel for them, (the one blaming the higher velocity of money on electronic banking was a real side-splitter) then you'll see it's not so hard after all.
I still don't think you understand my point at all. This is not about economics - this is about statistics. The whole question is about the best way to statistically estimate the rate of change of prices in the wider economy. Now, the result will be used by economists to make decisions but the question of how to get the number in the first place is a statistical question not an economics question. And to think that finding the best way to calculate it is not a good PhD question is, I think, to underestimate the complexity of the question.And yes, you can (and should) challenge people on it. I've already given the alternative to that.
As zar did above (and he seems pretty hot at maths), I think it is perfectly valid to have a look at the issue and then say "not enough of an expert to contribute something orginal to this thread", rather than weigh in regardless.0 -
OK - The starting point for calculating inflation is deciding what you mean by inflation. This might seem obvious "how much prices go up", but is actually incredibly difficult as we all have different ideas. Fundamentally the difference between the RPI and the CPI is what is being measured. Whether cynically we believe that politicians have opted for the lower of the two rather than the best is for each to judge!
There are two classic things that people mean by inflation. One is "how much would it cost to buy today what I bought a year ago", the other is to ask "how much would it cost to buy the equivalent of what I bought a year ago", a third one used less often is "how much would it cost to give me a certain standard of living compared to a year ago". They give very different results.
Of the three a "standard of living" index would rise the fastest as our expectations of living standards increases, people we consider to be poor now nonetheless materially have more than those we considered relatively OK 50 years ago. This has impacts for people in receipt of benefits and pensions, do we want them to benefit from rising living standards or not??
Of the other two concepts of inflation, buying today what I bought a year ago might have me still shopping in M&S when I now buy the equivalent in Primark because it is cheaper. Both the CPI and the RPI would still have me shopping in M&S, both measure the change in price of like-for-like objects. What is the biggest difference between them is that the RPI includes housing costs and the CPI doesn't. As we all know, housing costs are significant and they often tend to rise in line with wages rather than other goods (so by a higher amount).
It does make sense for the inflation target to exclude housing costs as they can change quite significantly in line with for example interest rate changes. Taking them from the calculation removes that distortion and enables them to focus more precisely on the important economic factors.
Whether pension increases should reflect housing costs is of course a different question, and whether benefits should is a different question again. Those are political debates to be had, ideally without reference to which is the cheapest - but instead to which is the fairest........
Of course, politicians would want us all to be Money Saving experts and shop around - meaning that potentially for us both measures of inflation overstate what we experience as they presume no shift between products or suppliers to get the best value. In practice trying to come up with that kind of measure of inflation would be fraught with problems because somebody else will argue that my Primark purchases are not equivalent to the M&S items I previously bought.
In terms of working out averages, generally speaking it will make little difference which mean is used as the basket is reviewed every year. But to take a ridiculous hypothetical example - Martin Lewis Jewellery becomes massively popular so included in the calculations. Martin then decides to cash in and doubles his prices each month through the year. Probably by March nobody is buying his Jewelley, but he doggedly still doubles the price every month selling virtually nothing. But the basket using a normal mean will presume that he is still selling the same quantity of Jewellery every month as he did in January and so the rate of inflation will rocket even though he is selling nothing. The reason for using complicated variations of the mean is to reduce this effect of the basket becoming out of date because only a few fools are now buying Martin's over-priced Jewellery.0 -
I still don't think you understand my point at all. This is not about economics - this is about statistics. The whole question is about the best way to statistically estimate the rate of change of prices in the wider economy.
The question is about inflation - which is economics. Statistics is a tool, rather in the same way as arithmetic/integration/differentiation are tools. You can't divorce statistics (or any other mathematical tool) from the underlying problem you're trying to solve, otherwise you end up with absurdities.
Official stats may be wrong, but believable, but once you get absurdities in official stats, then people do stop believing them. The Guardian article I posted earlier delves deeper into that."Follow the money!" - Deepthroat (AKA William Mark Felt Sr - Associate Director of the FBI)
"We were born and raised in a summer haze." Adele 'Someone like you.'
"Blowing your mind, 'cause you know what you'll find, when you're looking for things in the sky." OMD 'Julia's Song'0 -
You would use the geometric mean when you want to make inflation seem smaller.
For example - basket of goods:
Good A: 1p
Good B: 10p
Good C: £1
They go up by a penny.
Good A: 200%
Good B: 10%
Good C: 1%
Arithmetric mean: 73.3%
Geometric mean: 30.5%
On the assumption you buy 100 of A, 10 of B, and 1 of C, your old basket cost you £3, your new basket costs you £2+£1.10+£1.01=£4.11 which is 37% more money.
The rest of the article is a bit garbled. What the "not buying naffcaff" anymore but getting supermarket own brand is called is "substitution". This has nothing to do with arithmetric mean - it's a manual adjustment.
There is also a "my model of mobile has more ringtones this year" adjustment to the inflation figures. This is called hedonic (as in pleasure) adjustment. Since you are getting more pleasure out of this phone, but it hasn't changed in price - then it must be cheaper (as you're getting more features for the price). This again is a manual adjustment.
So, to run through the adjustments:
If naffcaff goes up in price, it is assumed that you will buy Poundland's "Floorscrapings of somewhere which sells nice coffee" - since that is poorer quality, and therefore cheaper, your basket of goods is cheaper, so inflation is low. This is the substitution adjustment.
If your mobile stays the same price (or has a small increase) but they loaded it with more games/ringtones - then someone at (I think it's National Statistics these days, but it could be the Treasury) gives a value to those extra features, and says that phone actually fell by that amount of money (despite you not being able to buy it at that price).
So: To recap.
If you buy something which is poorer quality, inflation goes down.
If you buy something which has better quality, inflation goes down.
If you calculate using the new geometric mean, inflation goes down.
Are there any questions?
I think there is an attempt to build in the automatic substitution effect
For example if there were 3 caffeine drinks Tea, Coffee and Chocolate all costing (say) 10p a mug and then chocolate (because of Ivory Coast) went to £10 a mug and coffee became £1 a mug (frost in Brazil) and tea doubled to 20p a mug, I for one would no longer get my daily fix of caffeine by drinking a mug of each. So this geometrical malarky would automatically adjust the effect of the cocoa famine.
How long it would take to realise that I have added some nasty synthetic "energy" drink called something like "Red Ox" (obviously an own brand) to my diet is anyone's guess.
Am I now a victim of inflation?
John.
PS The Census lady called to see me yesterday - looking for a fake address of a long demolished house - so I was able to give her back my duplicate copy of the form.
I asked her "Do you really expect that everyone will trust you with true answers to this intrusive questionnaire"
"This is nothing to do with the Government, we are ONS, the government will not get anything but statistics" I think I trust her but thousands wouldn't.0 -
I can't believe I'm replying again, but here goes...The question is about inflation - which is economics. Statistics is a tool, rather in the same way as arithmetic/integration/differentiation are tools. You can't divorce statistics (or any other mathematical tool) from the underlying problem you're trying to solve, otherwise you end up with absurdities.
Official stats may be wrong, but believable, but once you get absurdities in official stats, then people do stop believing them. The Guardian article I posted earlier delves deeper into that.
No! This question is very clearly about measuring inflation and specifically the validity of the use of the geometric mean in that calculation. This is a statistics question.
There are economics questions related to which choices are made when estimating this measure, but fundamentally it is a Stats question and I still say that it is not a simple question to define or to answer.0


This discussion has been closed.
Confirm your email address to Create Threads and Reply

Categories
- All Categories
- 355.2K Banking & Borrowing
- 254.7K Reduce Debt & Boost Income
- 455.8K Spending & Discounts
- 247.9K Work, Benefits & Business
- 605.1K Mortgages, Homes & Bills
- 178.8K Life & Family
- 262.8K Travel & Transport
- 1.5M Hobbies & Leisure
- 16.1K Discuss & Feedback
- 37.7K Read-Only Boards