We’d like to remind Forumites to please avoid political debate on the Forum.
This is to keep it a safe and useful space for MoneySaving discussions. Threads that are – or become – political in nature may be removed in line with the Forum’s rules. Thank you for your understanding.
PLEASE READ BEFORE POSTING: Hello Forumites! In order to help keep the Forum a useful, safe and friendly place for our users, discussions around non-MoneySaving matters are not permitted per the Forum rules. While we understand that mentioning house prices may sometimes be relevant to a user's specific MoneySaving situation, we ask that you please avoid veering into broad, general debates about the market, the economy and politics, as these can unfortunately lead to abusive or hateful behaviour. Threads that are found to have derailed into wider discussions may be removed. Users who repeatedly disregard this may have their Forum account banned. Please also avoid posting personally identifiable information, including links to your own online property listing which may reveal your address. Thank you for your understanding.
📨 Have you signed up to the Forum's new Email Digest yet? Get a selection of trending threads sent straight to your inbox daily, weekly or monthly!
The Forum now has a brand new text editor, adding a bunch of handy features to use when creating posts. Read more in our how-to guide
House prices

liam_h
Posts: 201 Forumite
Hi all.
Not sure if this has been asked before, sorry if it has.
I keep hearing people say house prices currently are at 2009 prices, or 2007 levels etc. As a FTB that has only just recently taken an interest in the market, I'm not sure what these levels are. I'm guessing 2009 prices were low, was 2007 prices lower than 2009 and where are we now roughly?
Anyone know? Thanks in advance
0
Comments
-
Hi all.
Not sure if this has been asked before, sorry if it has.
I keep hearing people say house prices currently are at 2009 prices, or 2007 levels etc. As a FTB that has only just recently taken an interest in the market, I'm not sure what these levels are. I'm guessing 2009 prices were low, was 2007 prices lower than 2009 and where are we now roughly?
Anyone know? Thanks in advance
Varies greatly by region but some say peak prices were about October/November 2007 and todays prices are roughly 10% below that level.
You could also say any comparison is irrelevant as all that matters is the price you would pay to own a particular property.0 -
No, 2007 was the peak of the market, ie prices were their highest. Most areas of the country have come down since then but apparently London is still as high as ever.
You can see past house prices here: http://www.housepricecrash.co.uk/graphs-index.php
Click on Halifax (national) and Nationwide (national) for an idea of how prices have risen and fallen. The number is the average house price.0 -
Easiest way to interprete house price changes is graphically. See page 3 of the most recent Nationwide house price index report (can't post the link here, type nationwide house prices into google).
In summary, there seems to be a V shape graph with a peak in the summer of 2007, a minima early 2009 and a recently curtailed upward trend to the present day. If you look at the long term graph, it seems like we are now more or less touching the long term average graph but should expect an undershoot if the past bubbles are anything to go by.0 -
Hi all.
Not sure if this has been asked before, sorry if it has.
I keep hearing people say house prices currently are at 2009 prices, or 2007 levels etc. As a FTB that has only just recently taken an interest in the market, I'm not sure what these levels are. I'm guessing 2009 prices were low, was 2007 prices lower than 2009 and where are we now roughly?
Anyone know? Thanks in advance
Rather than look at UK averages, best to focus on you own vested interest areas.
Land registry can give a good history.
go to http://www.landregistry.gov.uk/ and the search the house price index for your area
where is your location and we can help show you the detail.:wall:
What we've got here is....... failure to communicate.
Some men you just can't reach.
:wall:0 -
Where I live in South Wales, the boom started about 2002 and continued to about 2005 where i would say selling prices leveled off. Property maybe gained 80% during this time.
2006-2007 Might have seen small gains of 5-10% at most
2008 Prices started to fall and are now about 20% lower!
(I will say there are a few in demand areas close to me where price gains were higher, Mumbles and the Gower for example.)0 -
fast_fourier_transform wrote: »Easiest way to interprete house price changes is graphically. See page 3 of the most recent Nationwide house price index report (can't post the link here, type nationwide house prices into google).
Here the link
http://www.nationwide.co.uk/hpi/historical/q2_2010.pdf
or
http://www.nationwide.co.uk/hpi/historical/jul_2010.pdf
or fast_fourier_transform wrote: »
In summary, there seems to be a V shape graph with a peak in the summer of 2007, a minima early 2009 and a recently curtailed upward trend to the present day. If you look at the long term graph, it seems like we are now more or less touching the long term average graph but should expect an undershoot if the past bubbles are anything to go by.
Two things.
1. This is a UK average graph and the focus should be locally. Previous correction including the 90's showed some areas recovered fully within a year
2. Historical performance is no gaurantee of future expectancy. There are many different fundamentals which affects this correction and means it will possible be different from previous corrections. this is clearly seen on the graph as the early 80's correction did not go far below the trend with the 90's one did.
Once again I recommend you focus on the local area and investigate it's fundamentals:wall:
What we've got here is....... failure to communicate.
Some men you just can't reach.
:wall:0 -
And just to clarify, actual prices did not fall by anywhere near as much as that graph suggests. It's inflation adjusted, so just shows the price of houses relative to chocolate and bananas.
Actual house prices behaved very differently.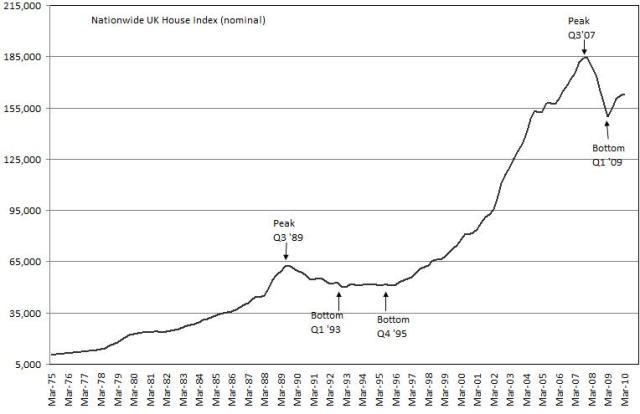 “The great enemy of the truth is very often not the lie – deliberate, contrived, and dishonest – but the myth, persistent, persuasive, and unrealistic.
Belief in myths allows the comfort of opinion without the discomfort of thought.”
-- President John F. Kennedy”0 -
Look at your local auction results and see what prices stuff is selling for.
Look at houseprices.co.uk too
Only "market" value prices get released - don't know why - perhaps it's to make the housing market look healthier than it is.0 -
HAMISH_MCTAVISH wrote: »And just to clarify, actual prices did not fall by anywhere near as much as that graph suggests. It's inflation adjusted, so just shows the price of houses relative to chocolate and bananas.
Actual house prices behaved very differently.
Certainly the correction of 2008 dropped more nominally and as a percentage than it did in the 90's
What we may have seen is a sharper, faster correction than previously, but a reflection on how the current markets react.
We certainly are more informed than previous generations:wall:
What we've got here is....... failure to communicate.
Some men you just can't reach.
:wall:0 -
poppysarah wrote: »Only "market" value prices get released - don't know why - .
That's not exactly right.
Land registry and Register of Scotland (and then the house price websites) do show actual sale prices for all properties, regardless of whether sold via auction or normal sales channels.
Most of the major house price indices do exclude distressed auction results and bulk purchases however, as they represent a tiny percentage of total sales, and are not indicative of fair value in the normal market.“The great enemy of the truth is very often not the lie – deliberate, contrived, and dishonest – but the myth, persistent, persuasive, and unrealistic.
Belief in myths allows the comfort of opinion without the discomfort of thought.”
-- President John F. Kennedy”0


This discussion has been closed.
Confirm your email address to Create Threads and Reply

Categories
- All Categories
- 354.4K Banking & Borrowing
- 254.4K Reduce Debt & Boost Income
- 455.4K Spending & Discounts
- 247.3K Work, Benefits & Business
- 604K Mortgages, Homes & Bills
- 178.4K Life & Family
- 261.5K Travel & Transport
- 1.5M Hobbies & Leisure
- 16K Discuss & Feedback
- 37.7K Read-Only Boards