We’d like to remind Forumites to please avoid political debate on the Forum.
This is to keep it a safe and useful space for MoneySaving discussions. Threads that are – or become – political in nature may be removed in line with the Forum’s rules. Thank you for your understanding.
Debate House Prices
In order to help keep the Forum a useful, safe and friendly place for our users, discussions around non MoneySaving matters are no longer permitted. This includes wider debates about general house prices, the economy and politics. As a result, we have taken the decision to keep this board permanently closed, but it remains viewable for users who may find some useful information in it. Thank you for your understanding.
📨 Have you signed up to the Forum's new Email Digest yet? Get a selection of trending threads sent straight to your inbox daily, weekly or monthly!
The Forum now has a brand new text editor, adding a bunch of handy features to use when creating posts. Read more in our how-to guide
Spot the suckers rally.
Comments
-
Here's one of the most spectacular lies of all.......PROPERTY BOTTOM - History tells us that property stagnates for years at the bottom, there will be no rapid rises at the bottom, don't rush.:think:
Whereas the reality is that history shows the exact opposite. In three of the last four downturns, including this one.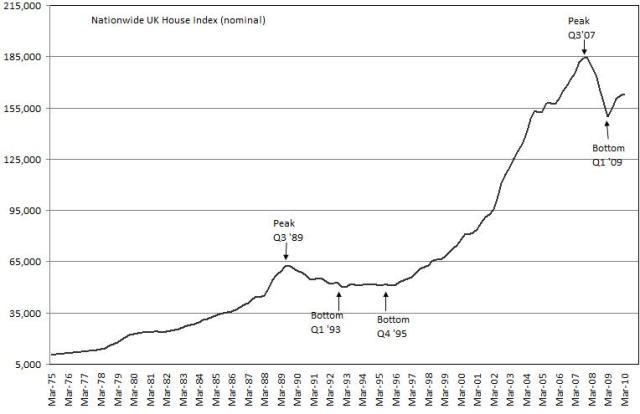
So that's just an outright lie. Clearly there for propaganda purposes, trying to dissuade people from buying houses.
Absolutely despicable behaviour, because anyone who believed that lie a year ago has cost themselves almost £20,000 on the average house by waiting......“The great enemy of the truth is very often not the lie – deliberate, contrived, and dishonest – but the myth, persistent, persuasive, and unrealistic.
Belief in myths allows the comfort of opinion without the discomfort of thought.”
-- President John F. Kennedy”0 -
IveSeenTheLight wrote: »You have historicall, repeatedly lied in your signature.
i don't actually think Brit sees it as a lie - he really believes all this stuff that he posts.HAMISH_MCTAVISH wrote: »Here's one of the most spectacular lies of all.......
there's more but leave him - he discredits himself frequently...
i'm sure Boomerangs or one of the other aliases will be along in a moment...0 -
HAMISH_MCTAVISH wrote: »Here's one of the most spectacular lies of all.......
Whereas the reality is that history shows the exact opposite. In three of the last four downturns, including this one.
So that's just an outright lie. Clearly there for propaganda purposes, trying to dissuade people from buying houses.
Absolutely despicable behaviour, because anyone who believed that lie a year ago has cost themselves almost £20,000 on the average house by waiting......
Being a bit stupid there Hamish, from 91-97 its pretty much stagnated after the crash. At no point am I calling 2009 the bottom of the crash infact the crash is continuing now. We haven't got close to the bottom. Spot where all the stimulus was added on your chart to stop the crash, shame for you it only lasted a year and prices are beging to fall again even in the peak selling period.:exclamatiScams - Shared Equity, Shared Ownership, Newbuy, Firstbuy and Help to Buy.
Save our Savers
0 -
what were the approval numbers when prices were falling?Chaos_A.D. wrote: »I still stagger when I see this graph, the peak is just ridiculously huge, based upon lax lending, liar loans, IR's too low for too long, cheap money, RMBS etc...etc. And the upward tick is only based on half the normal approvals that we have seen over the last 2 decades, 0.5% base rate and banks that can't afford to repossess.
Amazing how anything bullish that resembles reality can be argued to be honest.
more or less than now?0 -
and yet another lie from the resident liar....Being a bit stupid there Hamish, from 91-97 its pretty much stagnated after the crash. At no point am I calling 2009 the bottom of the crash infact the crash is continuing now. We haven't got close to the bottom. Spot where all the stimulus was added on your chart to stop the crash, shame for you it only lasted a year and prices are beging to fall again even in the peak selling period.
let's have a look at the last Nationwide quarterly report that covers the last 3 months. that's June, May and April... to see if house prices have fallen...
http://www.nationwide.co.uk/hpi/historical/Q2_2010.pdfHouse prices in London increased by 2.5% in the second quarter of 2010, slightly weaker than the 2.7% rise last quarter. The annual rate of price growth moderated slightly to 13.2%, although London remained the top performing region (in terms of annual house price inflation).0 -
another lie....
let's have a look at the last Nationwide quarterly report that covers the last 3 months. that's June, May and April...
http://www.nationwide.co.uk/hpi/historical/Q2_2010.pdf
Really well lets look at the Nationwide Figures.
April 1.1% up
May 0.5% up
June 0.1% up
http://www.nationwide.co.uk/hpi/historical/jun_2010.pdf
Those figures show a clear slow down to almost no rise. On top of that haven't they got a more southern reference compared to Halifax. This is in the peak buying period, whats happening. The gains are now below normal inflation so technically negative. Then take into count the downward trend and the worst economic data and there is a good chance these figures go negative next month.
On top of that Land registry, Halifax and Acadametrics figures are already negative.
Where is the lie Chucky?
Yet more slander as you can't win the argument.:exclamatiScams - Shared Equity, Shared Ownership, Newbuy, Firstbuy and Help to Buy.
Save our Savers
0 -
Being a bit stupid there Hamish, from 91-97 its pretty much stagnated after the crash.
Yes, that would be the only one of the last four downturns where it did.
One in four Brit...... Just one in four.
Property stagnates at the bottom for 25% of crashes.
How much farking clearer does it have to be said?At no point am I calling 2009 the bottom of the crash infact the crash is continuing now.
Another lie.
As Chucky pointed out above, prices are still rising above even the seasonal expectation.We haven't got close to the bottom. Spot where all the stimulus was added on your chart to stop the crash, shame for you it only lasted a year and prices are beging to fall again even in the peak selling period.
Another lie. As per Nationwide above, prices are still rising above seasonal expectations.
And the bottom was in Feb 2009.....:cool: There is no historical precedent for such a huge crash as we had. Twice the size of the 90's crash.
Even the hpc-ers are giving up and buying houses. Time for you to pack it in as well, before you lose what very little credibility you have left.“The great enemy of the truth is very often not the lie – deliberate, contrived, and dishonest – but the myth, persistent, persuasive, and unrealistic.
Belief in myths allows the comfort of opinion without the discomfort of thought.”
-- President John F. Kennedy”0 -
hahaha - you didn't look at the link.Really well lets look at the Nationwide Figures.
April 1.1% up
May 0.5% up
June 0.1% up
http://www.nationwide.co.uk/hpi/historical/jun_2010.pdf
Those figures show a clear slow down to almost no rise. On top of that haven't they got a more southern reference compared to Halifax. This is in the peak buying period, whats happening. The gains are now below normal inflation so technically negative. Then take into count the downward trend and the worst economic data and there is a good chance these figures go negative next month.
On top of that Land registry, Halifax and Acadametrics figures are already negative.
Where is the lie Chucky?
Yet more slander as you can't win the argument.
it was for London - why are you so interested in seasonal adjusted figures for the UK when you're looking to buy a place in London.
but let's look at you and you being a liar... how's this for an example Brit
i never realised that you were an ex-landlord. how come you didn't tell us?
http://www.landlordzone.co.uk/forums/showpost.php?p=48185&postcount=15Do you know why he selling? There quit a few landlords I know selling now in Berkshire. I sold one of mine a few weeks ago to make my portfolio a little sturdier due to the climate.
posting on numerous websites and forums to try and to influence the market with figments of your imagination.:T
that's being a troll and exposes you as what you are - a desperate liar0 -
HAMISH_MCTAVISH wrote: »Here's one of the most spectacular lies of all.......
That graph has been posted a couple times now, over such a long time period it needs currency to be inflation adjusted or at least put on an exponential scale
Or measure it in silver or gold or whatever you like, measure the price of a house in cans of Carling I think is a great idea
See how that graph looks when priced in real goods. Generally the price of everything has more then doubled since the 80's
Heres a suckers rally in shares. Anyone who invested in the SP500 since April 2009 has wasted their time, they should have bought gold instead. This seems to represent a substantial failure in company growth (on average) 0
0 -
are they really showing negative - i don't think so... yet another lie Brit...On top of that Land registry, Halifax and Acadametrics figures are already negative.
Where is the lie Chucky?
Yet more slander as you can't win the argument.
come on Brit - give it up. you're coming across as desperate deluded fool...0


This discussion has been closed.
Confirm your email address to Create Threads and Reply

Categories
- All Categories
- 353.9K Banking & Borrowing
- 254.3K Reduce Debt & Boost Income
- 455.2K Spending & Discounts
- 246.9K Work, Benefits & Business
- 603.5K Mortgages, Homes & Bills
- 178.3K Life & Family
- 261.1K Travel & Transport
- 1.5M Hobbies & Leisure
- 16.1K Discuss & Feedback
- 37.7K Read-Only Boards