We’d like to remind Forumites to please avoid political debate on the Forum.
This is to keep it a safe and useful space for MoneySaving discussions. Threads that are – or become – political in nature may be removed in line with the Forum’s rules. Thank you for your understanding.
📨 Have you signed up to the Forum's new Email Digest yet? Get a selection of trending threads sent straight to your inbox daily, weekly or monthly!
The Forum now has a brand new text editor, adding a bunch of handy features to use when creating posts. Read more in our how-to guide
What to expect from an IFA?
Comments
-
The underlying data used appears to be US centric and self compiled. Not much use to a UK based investor.dunstonh said:As an additional update I found the following calculator online and pumped in my figures Retirement Withdrawal Calculator | Wealth MetaIts interesting that the simulation low (1915) showed a compound growth rate of 4.8%.
The decade from 2000 to 2009 (10 year period) was negative for stocks. I would have thought that a 10 year slice low would have showed a negative and not growth.0 -
The highlighted result was 2019 not 2009 (so 2010-2019), although I admit to having no idea re the underlying data myself. £560k - £360k withdrawal and a £224k balance - so only £24k growth over 10 years.dunstonh said:As an additional update I found the following calculator online and pumped in my figures Retirement Withdrawal Calculator | Wealth MetaIts interesting that the simulation low (1915) showed a compound growth rate of 4.8%.
The decade from 2000 to 2009 (10 year period) was negative for stocks. I would have thought that a 10 year slice low would have showed a negative and not growth.0 -
Yes. The original link I used was Pension Drawdown Calculator: Retirement Drawdown Calculator - Easy Use (2020financial.co.uk) but it does seem it links to a US calculator.The underlying data used appears to be US centric and self compiled. Not much use to a UK based investor.
If there are any good (simple to use) UK biased tools out there then would welcome being pointed in the right direction.0 -
I was looking at:Pat38493 said:
Looking at the screen shot, it is 60% in bonds - would that help to explain it?dunstonh said:As an additional update I found the following calculator online and pumped in my figures Retirement Withdrawal Calculator | Wealth MetaIts interesting that the simulation low (1915) showed a compound growth rate of 4.8%.
The decade from 2000 to 2009 (10 year period) was negative for stocks. I would have thought that a 10 year slice low would have showed a negative and not growth.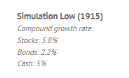
It looks like that is how they are breaking down the growth of each asset class. i.e. stocks low is 5.8%The highlighted result was 2019 not 2009 (so 2010-2019), although I admit to having no idea re the underlying data myself. £560k - £360k withdrawal and a £224k balance - so only £24k growth over 10 years.If the software has used 124 simulations of 10 years in length between 1900 and 2023 then one of those simulations should have been 2000-2009.I am an Independent Financial Adviser (IFA). The comments I make are just my opinion and are for discussion purposes only. They are not financial advice and you should not treat them as such. If you feel an area discussed may be relevant to you, then please seek advice from an Independent Financial Adviser local to you.0 -
Ah, I understand what you are saying now. You would expect to see a negative growth line on the chart for 2000-09If the software has used 124 simulations of 10 years in length between 1900 and 2023 then one of those simulations should have been 2000-2009.0 -
A less advanced forecast from Pension Drawdown Calculator (fidelity.co.uk)

Lower than the other calculator but not a world away. £184k left after 10 years in poor conditions.0 -
Yes but 2000 might not have been the overall lowest result, or am I misunderstanding the screens? It looks like it is showing "simulation low" as the one with the lowest overall end balance.dunstonh said:
If the software has used 124 simulations of 10 years in length between 1900 and 2023 then one of those simulations should have been 2000-2009.
I interpreted that to mean that from 1915 to 1925 stocks grew by 5.8%.
Mind you - it's a good trick in those modelling tools to set a much shorter time horizon so that 2000 to 2009 is included - I have done that on a few simulations as well.0 -
Yes but 2000 might not have been the overall lowest result, or am I misunderstanding the screens? It looks like it is showing "simulation low" as the one with the lowest overall end balance.It may not have been the lowest but it was certainly a negative period. But the charting is saying that the lowest was positive.I interpreted that to mean that from 1915 to 1925 stocks grew by 5.8%.I think that figure is either annualised or that single year. However, neither seems likely based on the figures used.
i.e. +5.8% is not low enough for a single year or a 10 year period and the high period is not enough for a 10 years period. I am not sure its enough for a single year either (we have had several close to that in the last 25 years. So, I think the high would be above it)
I am an Independent Financial Adviser (IFA). The comments I make are just my opinion and are for discussion purposes only. They are not financial advice and you should not treat them as such. If you feel an area discussed may be relevant to you, then please seek advice from an Independent Financial Adviser local to you.0


Confirm your email address to Create Threads and Reply

Categories
- All Categories
- 353.8K Banking & Borrowing
- 254.2K Reduce Debt & Boost Income
- 455.2K Spending & Discounts
- 246.9K Work, Benefits & Business
- 603.4K Mortgages, Homes & Bills
- 178.2K Life & Family
- 260.9K Travel & Transport
- 1.5M Hobbies & Leisure
- 16K Discuss & Feedback
- 37.7K Read-Only Boards