We’d like to remind Forumites to please avoid political debate on the Forum.
This is to keep it a safe and useful space for MoneySaving discussions. Threads that are – or become – political in nature may be removed in line with the Forum’s rules. Thank you for your understanding.
📨 Have you signed up to the Forum's new Email Digest yet? Get a selection of trending threads sent straight to your inbox daily, weekly or monthly!
The Forum now has a brand new text editor, adding a bunch of handy features to use when creating posts. Read more in our how-to guide
Have 10% inflation and falling markets affected your drawdown plan?
Comments
-
As Bostonerimus mentioned, it's the psychological stress of inflation that's hard to deal with once you're retired. Firstly, you've no idea how long it will last. Secondly, you've no idea how long you will last either. It's frustrating to hear my friends moan about the increasing price of a pint when they're all still working and earning money. Meanwhile I feel I've less than nothing coming in as my investments plunge. I do my spreadsheets, work my models, project forward and think I'm still okay. But at my back sits dark anxiety.6
-
With financial markets somewhat different nowadays to 100 or 50 years ago, I wonder whether any comparison is that easy. For example investing fees are a lot lower than in the past and presumably a lot of other things are different.OldScientist said:A day late for halloween, but here are a selection of horrid UK retirements (each with a 3% inflation adjusted withdrawal, 60% stocks, 20% bonds, and 20% cash). The real value of the portfolio is plotted as a function of time)
Retired in 1972 (just in time for the oil crash and subsequent inflation). Portfolio down to about 30% of initial value in real terms within 3 years of retirement. However, after the scary first decade, the 80s and 90s were good to this retiree (falling bond rates and good stock market returns).
Retired in 1937 (WWII, post war austerity and high inflation in late 50s and early 60s). Portfolio didn't quite last until the world cup in 1966. The portfolio was down to about half of its initial value in the first 4 years or so where it at least stabilised for a bit. Post war was unpleasant.
And retired in 1911 (WWI, massive inflation at the end of WWI followed, luckily, by a period of deflation in the early 20s). Not too bad for the first 4 years, followed by a scary drop to 30% of the initial value 10 years after retirement from which the portfolio never recovered. This would have been a gruelling retirement (leaving aside WWI and the start of WWII).
Thankfully, so far, current events have yet to match these.
Don't have nightmares - do sleep well
Or do the basics of a 60:20:20 portfolio work out pretty much the same ?0 -
Even with 1937, a slight course change after 15 years (i.e. when the portfolio dropped to 20% of the original value) reducing the withdrawal rate to 2.7% would have just ensured portfolio survival for the 30 years. It also happens that using a different inflation model to the one I've used (the database at https://www.macrohistory.net), and there are at least 4 versions of UK inflation before 1948 (when RPI was officially introduced), allows 1937 to survive at 3%.bostonerimus said:
Yes 3% would have survived most of the really bad years - the graphs show that the retiree would have been ok for at least 30 years except for 1937. I find it hard to believe that retiring in 2021/22 will be worse than in 1937, but I'd still find it hard to keep ploughing ahead with 3% plus inflation right now.OldScientist said:A day late for halloween, but here are a selection of horrid UK retirements (each with a 3% inflation adjusted withdrawal, 60% stocks, 20% bonds, and 20% cash). The real value of the portfolio is plotted as a function of time)
Retired in 1937 (WWII, post war austerity and high inflation in late 50s and early 60s). Portfolio didn't quite last until the world cup in 1966. The portfolio was down to about half of its initial value in the first 4 years or so where it at least stabilised for a bit. Post war was unpleasant.
You've mentioned the psychological effects - the 1937 retiree would have been very worried both in 1940 when the portfolio was down to half real value (after 3 years!) and even more so by 1952 when it was down to 20% of the original value and it would have been this that would cause them to abandon the plan.1 -
Albermarle said:
With financial markets somewhat different nowadays to 100 or 50 years ago, I wonder whether any comparison is that easy. For example investing fees are a lot lower than in the past and presumably a lot of other things are different.OldScientist said:A day late for halloween, but here are a selection of horrid UK retirements (each with a 3% inflation adjusted withdrawal, 60% stocks, 20% bonds, and 20% cash). The real value of the portfolio is plotted as a function of time)
Retired in 1972 (just in time for the oil crash and subsequent inflation). Portfolio down to about 30% of initial value in real terms within 3 years of retirement. However, after the scary first decade, the 80s and 90s were good to this retiree (falling bond rates and good stock market returns).
Retired in 1937 (WWII, post war austerity and high inflation in late 50s and early 60s). Portfolio didn't quite last until the world cup in 1966. The portfolio was down to about half of its initial value in the first 4 years or so where it at least stabilised for a bit. Post war was unpleasant.
And retired in 1911 (WWI, massive inflation at the end of WWI followed, luckily, by a period of deflation in the early 20s). Not too bad for the first 4 years, followed by a scary drop to 30% of the initial value 10 years after retirement from which the portfolio never recovered. This would have been a gruelling retirement (leaving aside WWI and the start of WWII).
Thankfully, so far, current events have yet to match these.
Don't have nightmares - do sleep well
Or do the basics of a 60:20:20 portfolio work out pretty much the same ?
I agree, the markets are different - as you say fees are lower (which may encourage people to be more active), indexing allows people to hold a large number of different companies (I think it would only have been investment trusts that allowed relatively small investors to hold the shares of many different companies), more people are now involved in investing, and the markets are better regulated.
But, similar patterns of returns could reoccur. For example,
1) A sudden and unexpected increase in inflation (UK 1918, 70s, and now). This was not sustained in 1918 but was in the 1970s. I have no idea whether it will be sustained now.
2) A dramatic drop in some asset values (US 1929, UK 1973/74, globally 2008).
3) Long periods of excellent bond returns (UK 1920-1930 and 1980 to fairly recently). This assumes bonds of fixed duration are held rather than being held to maturity (so more akin to a bond fund)
4) Long periods of dreadful bond returns (1940-1960). Bond returns may or may not be dreadful from now onwards (again, bond funds have been clobbered recently, but anyone holding bonds to maturity would not have been).
So, I think the historical data are useful since they at least give a sense check to a withdrawal plan, i.e. drawing an inflation adjusted 5% is not likely to be sensible (it failed in about half of historical retirements with the above portfolio), 4% is marginal (25% historical failures), whereas somewhere around 3% was sensible in the past. So there definitely shouldn't be arguments over the 2nd decimal place of safe withdrawal rates (while I've not finished doing all the work, it is doubtful that the precision of SWR is much better than 50 basis points), but they give a rough idea.
0 -
I have looked at these historical tools quite a bit for my retirement planning. As you say, hopefully they give a good guideline to the situation. The only thing that worries me slightly is that by the nature of these tools, the last scenario you can look at a full data set on is retirement in 1991 for a 30 year retirement or 1981 for an early retirement which would be one of my possible scenarios. The word feels like a very different place now than it did in 1981. There is a lot of data in those models, but on the other hand they only cover a relatively short period in the grand scheme of all civilisation I do sometimes wonder if they give me a false sense of security.OldScientist said:So, I think the historical data are useful since they at least give a sense check to a withdrawal plan, i.e. drawing an inflation adjusted 5% is not likely to be sensible (it failed in about half of historical retirements with the above portfolio), 4% is marginal (25% historical failures), whereas somewhere around 3% was sensible in the past. So there definitely shouldn't be arguments over the 2nd decimal place of safe withdrawal rates (while I've not finished doing all the work, it is doubtful that the precision of SWR is much better than 50 basis points), but they give a rough idea.
2 -
So I fon't think saying 'Look 3% works' is the correct takeaway.OldScientist said:A day late for halloween, but here are a selection of horrid UK retirements (each with a 3% inflation adjusted withdrawal, 60% stocks, 20% bonds, and 20% cash). The real value of the portfolio is plotted as a function of time)
Retired in 1972 (just in time for the oil crash and subsequent inflation). Portfolio down to about 30% of initial value in real terms within 3 years of retirement. However, after the scary first decade, the 80s and 90s were good to this retiree (falling bond rates and good stock market returns).
Retired in 1937 (WWII, post war austerity and high inflation in late 50s and early 60s). Portfolio didn't quite last until the world cup in 1966. The portfolio was down to about half of its initial value in the first 4 years or so where it at least stabilised for a bit. Post war was unpleasant.
And retired in 1911 (WWI, massive inflation at the end of WWI followed, luckily, by a period of deflation in the early 20s). Not too bad for the first 4 years, followed by a scary drop to 30% of the initial value 10 years after retirement from which the portfolio never recovered. This would have been a gruelling retirement (leaving aside WWI and the start of WWII).
Thankfully, so far, current events have yet to match these.
Don't have nightmares - do sleep well
the real takeaway is that even with a relatively low 3% there are many cases where DD would have been reduced by any real world retiree rather than risking running out of money.
Look at it this way, someone retiring in 1975 would have had an SWR of 7 or 8% as this is the same as 3% of what the 1972 pot had fallen to in 1975. If you assume the 3% )of the 72 pot) was safe to continue with in 1975 based on history then you are also saying the 7.5% (of the 1975 pot) is safe (for a 27 year retirement) as mathematically they are equivalent.I think....2 -
I would agree - the constant pound approach is a useful guide, but (IMO) dreadful to actually implement. Your point about 1972 and 1975 is correct - a plot of the SWR values for each retirement is plotted belowmichaels said:
So I fon't think saying 'Look 3% works' is the correct takeaway.OldScientist said:A day late for halloween, but here are a selection of horrid UK retirements (each with a 3% inflation adjusted withdrawal, 60% stocks, 20% bonds, and 20% cash). The real value of the portfolio is plotted as a function of time)
Retired in 1972 (just in time for the oil crash and subsequent inflation). Portfolio down to about 30% of initial value in real terms within 3 years of retirement. However, after the scary first decade, the 80s and 90s were good to this retiree (falling bond rates and good stock market returns).
Retired in 1937 (WWII, post war austerity and high inflation in late 50s and early 60s). Portfolio didn't quite last until the world cup in 1966. The portfolio was down to about half of its initial value in the first 4 years or so where it at least stabilised for a bit. Post war was unpleasant.
And retired in 1911 (WWI, massive inflation at the end of WWI followed, luckily, by a period of deflation in the early 20s). Not too bad for the first 4 years, followed by a scary drop to 30% of the initial value 10 years after retirement from which the portfolio never recovered. This would have been a gruelling retirement (leaving aside WWI and the start of WWII).
Thankfully, so far, current events have yet to match these.
Don't have nightmares - do sleep well
the real takeaway is that even with a relatively low 3% there are many cases where DD would have been reduced by any real world retiree rather than risking running out of money.
Look at it this way, someone retiring in 1975 would have had an SWR of 7 or 8% as this is the same as 3% of what the 1972 pot had fallen to in 1975. If you assume the 3% )of the 72 pot) was safe to continue with in 1975 based on history then you are also saying the 7.5% (of the 1975 pot) is safe (for a 27 year retirement) as mathematically they are equivalent.
That huge spike in SWR in the 1970s onwards starts in 1975 (you would have got away with over 4% in 1972 because of the performance later on). However, you'd never know this when you started your retirement.0 -
There are two significant problems with constant income approaches from a variable portfolioPat38493 said:
I have looked at these historical tools quite a bit for my retirement planning. As you say, hopefully they give a good guideline to the situation. The only thing that worries me slightly is that by the nature of these tools, the last scenario you can look at a full data set on is retirement in 1991 for a 30 year retirement or 1981 for an early retirement which would be one of my possible scenarios. The word feels like a very different place now than it did in 1981. There is a lot of data in those models, but on the other hand they only cover a relatively short period in the grand scheme of all civilisation I do sometimes wonder if they give me a false sense of security.OldScientist said:So, I think the historical data are useful since they at least give a sense check to a withdrawal plan, i.e. drawing an inflation adjusted 5% is not likely to be sensible (it failed in about half of historical retirements with the above portfolio), 4% is marginal (25% historical failures), whereas somewhere around 3% was sensible in the past. So there definitely shouldn't be arguments over the 2nd decimal place of safe withdrawal rates (while I've not finished doing all the work, it is doubtful that the precision of SWR is much better than 50 basis points), but they give a rough idea.
1) You don't know whether the SWR for your retirement will be better or worse than those found historically (even choosing a conservative WR)
2) You don't know whether you will live longer than your planned period (although there's not a lot of difference between 30 and 35 years in terms of the SAFEMAX, maybe 20 basis points).
One potential solution is
1) Ensure guaranteed income (i.e., state pension, DB pension, inflation protected annuity or bond ladder) meets most (if not all) essential spending, and
2) Accept variable withdrawals (the question then being how much variability). There are huge number of different variable withdrawal methods (two examples for 1937 below).
Endowment (I've followed Bob Carlson's naming here). In the following example an inflation linked 0.75*3=2.25% withdrawal (constant pound) is combined with 0.25*3% of current portfolio value (constant percentage). Withdrawals are below 3% for the whole retirement, but there is still money left after 30 years. In good retirements, withdrawals will be greater than 3%. This approach can still fail prematurely if the SWR for a future retirement is below 2.25% (adopting a different ratio of constant pound and constant percentage withdrawals, say 50/50 will improve the robustness at the expense of additional variability in income and a lower floor).
Withdraw the minimum of 3% inflation linked withdrawal and 9% of current portfolio value (essentially this means that constant pound will be used until portfolio drops below 33% of the original value in real terms when it will be replaced by constant percentage). Withdrawals are steady for more than a decade to start with, but then get very variable, and low, towards the end of retirement. As for the endowment case, there is still money left in the portfolio after 30 years - in fact this approach can never run out of money (but withdrawals can get very small). The withdrawals can be smoothed (e.g. by using a 3 year average of the portfolio value), but this reintroduces a risk of failure before the end of retirement. A higher initial rate (e.g. 4%) can be used, since the method will automatically adapt to worse conditions (but income and portfolio value will be lower towards the end of retirement).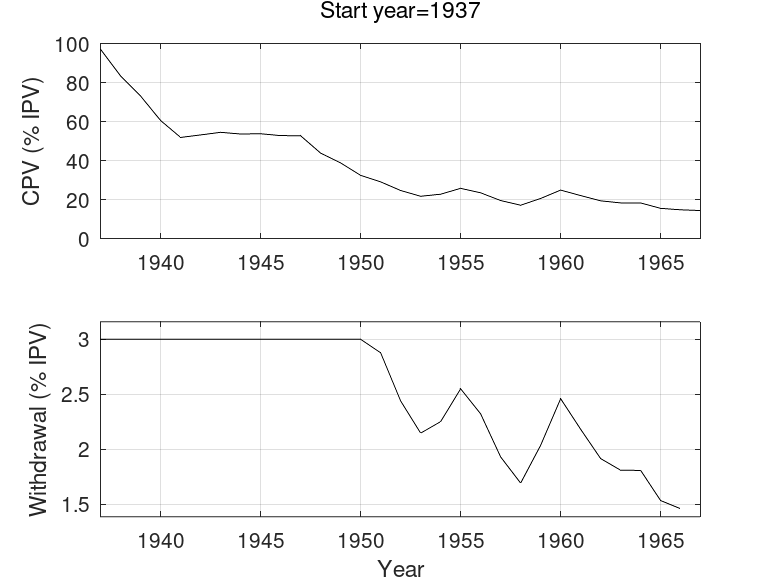
Both of these solutions are relatively straightforward, but neither solution (or indeed any of the myriad other approaches) is 'better' than the other or indeed 'better' than constant pound, but they do behave differently (and, therefore, which is acceptable depends on the individual).
In the interests of contributing to the actual topic(!), my own withdrawals are based on a slight variant of Variable Percentage Withdrawal (see https://www.bogleheads.org/wiki/Variable_percentage_withdrawal) which means that the withdrawals vary fully with the portfolio value - so withdrawals have declined in real terms since the start of retirement 3 years ago. Since all of our expenditure (essential and everyday discretionary) is currently covered by a (partly inflation capped) DB pension, then this variability doesn't matter too much to us at the moment.
1 -
OldScientist said:Since all of our expenditure (essential and everyday discretionary) is currently covered by a (partly inflation capped) DB pension, then this variability doesn't matter too much to us at the moment.In that case, pretty much any "reasonable" drawdown plan will work for you, since the consequences of plan failure are nothing like as severe as they'd be for someone totally reliant on investments, such as DC pensions etc, and hence you could probably accept more plan risk.I suppose we'll nearly all have at least some level of "DB" type pension in the end, in the form of the state pension - but for many that won't even cover essential spending, let alone everyday discretionary.
1 -
Even if a DB pension is nowhere near large enough to cover essentials, it still reduces pressure on the DC pension/SWR significantly, unless you are walking a very tightrope. Then if you add in later one or two state pensions, it reduces the pressure even more of course,MK62 said:OldScientist said:Since all of our expenditure (essential and everyday discretionary) is currently covered by a (partly inflation capped) DB pension, then this variability doesn't matter too much to us at the moment.In that case, pretty much any "reasonable" drawdown plan will work for you, since the consequences of plan failure are nothing like as severe as they'd be for someone totally reliant on investments, such as DC pensions etc, and hence you could probably accept more plan risk.I suppose we'll nearly all have at least some level of "DB" type pension in the end, in the form of the state pension - but for many that won't even cover essential spending, let alone everyday discretionary.0


Confirm your email address to Create Threads and Reply

Categories
- All Categories
- 354.6K Banking & Borrowing
- 254.5K Reduce Debt & Boost Income
- 455.5K Spending & Discounts
- 247.5K Work, Benefits & Business
- 604.3K Mortgages, Homes & Bills
- 178.5K Life & Family
- 261.8K Travel & Transport
- 1.5M Hobbies & Leisure
- 16.1K Discuss & Feedback
- 37.7K Read-Only Boards