We’d like to remind Forumites to please avoid political debate on the Forum.
This is to keep it a safe and useful space for MoneySaving discussions. Threads that are – or become – political in nature may be removed in line with the Forum’s rules. Thank you for your understanding.
Use of Diagrams to Explain Complex Pension Rules


As a long time lurker / occasional poster, I have learned much from the expertise of the contributors on this forum and I admire the patience shown with the genuine requests for help. For me there are two main types of contributions that are sought:
- Opinions/Suggestions on a particular set of circumstances and
- Explanation of rules/laws.
Both are mostly tackled in the same manner with written (often verbose) explanations, suggestions and opinions. For (1), the mix of different skills, experience and attitudes from contributors make for better debates. Different interpretations of language / terminology are sorted out (mostly quickly, but sometimes painfully imho). The exploring of different situations and options to address them prove to be valuable to lots of readers and works well. However, I find that (2) explaining rules (often complex in nature) usually takes several iterations before an understanding is reached and can cause confusion when several contributors are explaining their version at the same time - no criticism, it is how the tool works. Having a background in IT, I know that diagrams can be a useful aid in explaining complexity. Rules can be laid out fairly succinctly and the debate can move more quickly to the value-add areas like the correct interpretation of the rules, how to apply them, how good or bad they are and what would improve them, etc.
I've provided a draft example below of the Annual Allowance rules (as I understand them) into a workflow(-ish) diagram to see if people find it a helpful way of presenting it and if so, corrections, additions and to what other subjects could diagrams be usefully applied.
To be clear, I am no expert on Pension rules and so I am suggesting a pooling of skills and knowledge for areas where picture/diagrams/workflows could help and the more informed can contribute to arrive at a master version that the represents the broad understanding. If Subject Matter Experts point out corrections / improvements /updates, provide working examples, etc, I believe there will be regular forum-goers with appropriate IT skills and tools to incorporate the ideas and knock-up something reasonably quickly. This is just an idea based on following the forum and who is willing to contribute where I may be able to add a little value. I suspect I am not alone in wanting to help. If the idea doesn't fly then I'm sure you'll let me know in a kindly manner, as befitting of the forum.
Thanks.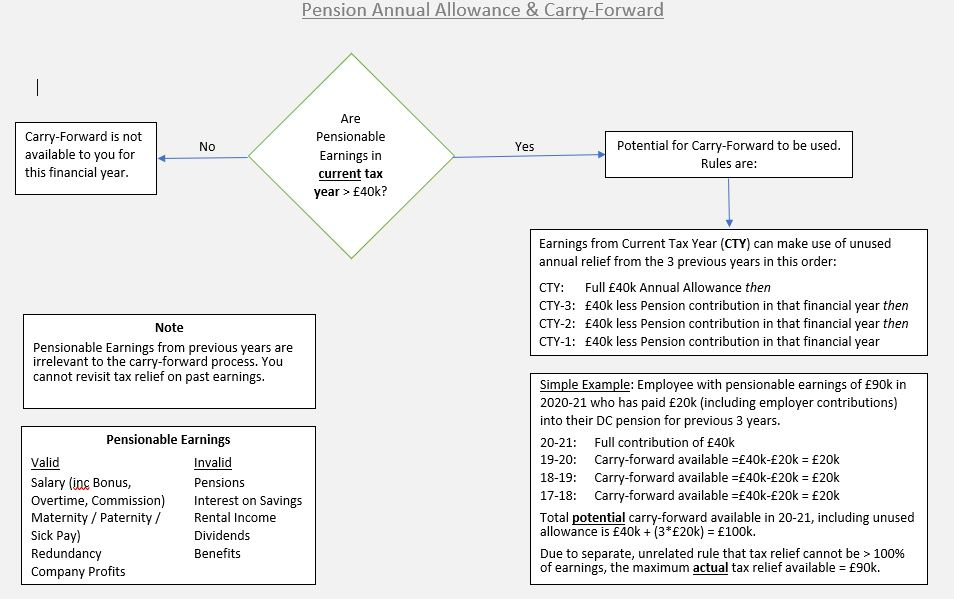
Comments
-
Looks good - can we use it every time this subject is misunderstood by a poster ( about once a day ) ?2
-
The problem is your first decision box is wrong, whether you earn more than 40k or not is not necessarily a determining factor on the use of carry forward.
Somebody could have a generous (pension wise) employer who pays 40k into a pension but only pays a salary of 20k, in this case the employee would have to make use of carry forward to contribute to a pension, despite (according to your diagram) not earning more than 40k. Unlikely situation perhaps but it is within the rules of AA and carry forward.
Another example is that DB pensions can use up large amounts of the AA without people realising, again meaning people can end up using carry forward despite not earning more than 40k.
The entire problem which people often get confused of AA and carry forward is exactly because people try to conflate two separate but distinct limits into a simple question like do you earn more than 40k?
3 -
Anything which aids understanding, whatever the topic, is an excellent idea. Some of the pension providers use flowcharts for certain areas, but there's a good reason why they don't always do the trick with more complex topics. NoMore's post gives a good explanation of why/how difficult it is to condense extreme complexity into the (laudably) simplistic approach you have suggested.Googling on your question might have been both quicker and easier, if you're only after simple facts rather than opinions!3
-
The excellent Royal London guide often linked to on this board when the topic of State Pension forecasts and working out how / whether you need to top it up makes very good use of flow diagrams
2 -
NoMore said:The problem is your first decision box is wrong, whether you earn more than 40k or not is not necessarily a determining factor on the use of carry forward.
Somebody could have a generous (pension wise) employer who pays 40k into a pension but only pays a salary of 20k, in this case the employee would have to make use of carry forward to contribute to a pension, despite (according to your diagram) not earning more than 40k. Unlikely situation perhaps but it is within the rules of AA and carry forward.
Another example is that DB pensions can use up large amounts of the AA without people realising, again meaning people can end up using carry forward despite not earning more than 40k.
The entire problem which people often get confused of AA and carry forward is exactly because people try to conflate two separate but distinct limits into a simple question like do you earn more than 40k?Indeed. See also this Pru link which explains it:You need to have two separate tests, the tax relief limit, and the annual allowance, then take lower of the two.The thing that causes all the confusion is trying to combine the limits in one calculation/flow. You can't. They measure different things, they have different rules, and the consequences of exceeding them are different.So do one flow for the tax relief limit.Then do one for the annual allowance.Then take the lower of the two for the answer.As explained in the Pru link.
2 -
Incidentally, Pru also provide a flowchart themselves, to help with planning the drawdown process:fromhttps://www.pruadviser.co.uk/knowledge-literature/knowledge-library/flexi-access-drawdown-vs-ufpls/#
2 -
The idea of this is good so had a go at a suggested flow/sw spec, with a few assumptions to avoid too much complexity.It answers the question "how much can I pay into my SIPP this tax year"Assumptions:
- Employed or self employed person
- Taxable earnings between £3600 and £100,000
- Not subject to the MPAA
- Not in Scotland (though it'll probably work)
- Are you in a workplace pension [no - goto 4]
- Do you contribute to it using "RAS"? [no - goto 4]
- Tax relief limit TRL = taxable earnings minus gross employee workplace pension contributions [goto 5]
- Tax relief limit TRL = taxable earnings
- Are you in a workplace DB pension [no - goto 7]
- CYW = likely DB PIA this tax year (this will always be a guess, err on the top end possible) [goto 8]
- CYW = total of all employer and employee contributions this tax year (employee grossed up if RAS)
- CFA = available carry forwards from previous years (see notes below)
- Annual allowance available AAA = £40,000 + CFA - CYW
- Is AAA > TRL [yes - goto 12]
- Max gross SIPP contribition is AAA (so net is 80% of this)
- Max gross SIPP contribition is TRL (so net is 80% of this)
Footnotes/definitions:MPAA - money purchase annual allowance. Where a pension has been "flexibly accessed". Google MPAA triggers.RAS - relief at source. Where contributions are deducted after tax is applied and basic rate relief is claimed by the pension scheme. In the case of workplace schemes these are usually "group personal pensions".Earnings - generally employment income/self employment profit. See "relevant earnings" in https://www.gov.uk/hmrc-internal-manuals/pensions-tax-manual/ptm044100Taxable earnings - earnings on which income tax is assesed - as appears on the P60 or "taxable earnings to date" on payslips (note - if in a "net pay" or sal sac scheme taxable earnings have already been reduced by contributions)Gross - including the tax relief - eg an £80 net contribution to a RAS scheme is £100 gross after tax relief addedDB PIA - increase in pension value - see https://www.gov.uk/hmrc-internal-manuals/pensions-tax-manual/ptm053301Carry forwards available - see https://www.hl.co.uk/pensions/contributions/carry-forward-rule/annual-allowance-calculatorI expect there are flaws/exceptions in this so don't rely on it. Also need to understand the definitions, that's probably the hard part.3 - Employed or self employed person
-
I cheered when I saw your diagram. Lovely work.0


Confirm your email address to Create Threads and Reply

Categories
- All Categories
- 354.4K Banking & Borrowing
- 254.4K Reduce Debt & Boost Income
- 455.4K Spending & Discounts
- 247.3K Work, Benefits & Business
- 604K Mortgages, Homes & Bills
- 178.4K Life & Family
- 261.5K Travel & Transport
- 1.5M Hobbies & Leisure
- 16K Discuss & Feedback
- 37.7K Read-Only Boards