We’d like to remind Forumites to please avoid political debate on the Forum.
This is to keep it a safe and useful space for MoneySaving discussions. Threads that are – or become – political in nature may be removed in line with the Forum’s rules. Thank you for your understanding.
The Alternative Green Energy Thread
Comments
-
You say:ed110220 said:
There's no comparison between the UK and China though. If there's curtailment in China it's despite massive transmission upgrades because China's solar and wind roll-out has been so enormous. 5 and 6% are pretty low curtailment rates and probably aren't much to worry about for cheaply produced electricity. China installed 212 GW of solar in the first half of this year. To put that in perspective the second-largest nation for solar capacity – the US – had only installed 178GW, in total, by the end of 2024, while third-ranked India had 98GW. Let that sink in - in half a year China installed more solar than the USA has ever installed!JKenH said:
Indeed, I’ve been saying that for years. Perhaps the present incumbents might think about prioritising storage and getting the grid sorted ahead of building any more wind or solar farms. Sadly, upgrading the grid isn’t half as sexy as adding generating capacity. Countries are judged by how much renewables capacity they add, not how effective it is.Netexporter said:Perhaps if previous governments had addressed the, blindingly obvious, need for storage, to even out intermittency/over-supply, there wouldn't be such a problem.
China has a similar problemChina's renewable power potential in far-flung provinces is increasingly going unused, official statistics showed on Monday, as the country rushes to build more long-distance transmission and energy storage to bridge the gap.The curtailment rate for solar power rose to 6.6% in the first half of 2025 from 3.9% in the same period a year earlier while the rate for wind rose to 5.7% from 3%, according to the National New Energy Consumption Monitoring and Early Warning Center.
https://www.reuters.com/sustainability/climate-energy/chinas-renewable-capacity-soars-utilisation-lags-data-show-2025-08-05/
Britain's grid is basically the same as it was in the late 20th C, apart from the undersea interconnectors; China has built a whole ultra-high voltage transmission system like nothing else in the world in the last 15 years. China has built whole 1000 kV AC grids in that time - the UK and West-Central Europe max out at 400 kV. No other country has more than 765 kV AC. The amount of power that can be transmitted rises dramatically with increasing voltage while losses fall, making transmission over longer distances practical. They've also built or are building at least 27 long distance 800 kV or more DC links, the longest over 3000 km long.
Check out the Wikipedia page on ultra-high voltage electricity transmission in China
Also Open Infrastructure Map - bright blue is >750 kV AC, dark blue is HVDC/UHVDC. It's open source and users only seem to add lines once they appear in publicly available satellite imagery so many of the lines listed on Wikipedia don't even appear yet - again showing how quickly things are moving.
I don't read Mandarin but looking at translated Chinese media they seem to make quite a big thing of these schemes, boasting of how much electricity will be transmitted, the biggest in the world, the highest altitude installation etc.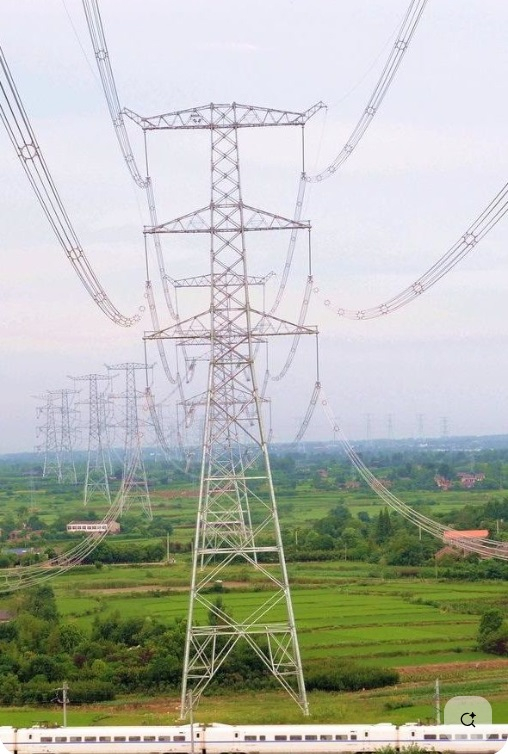
1000 kV AC double circuit. The description says the towers are 100 m tall - the typical 400 kV pylons in the UK are less than 50 m tall, so would probably fit under the lowest arms of this giant.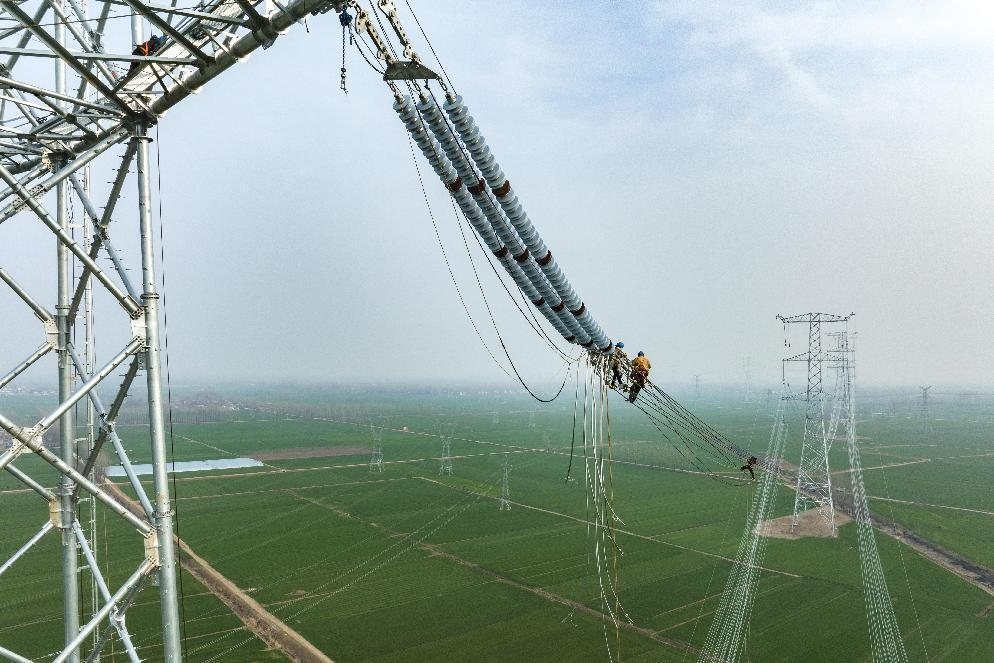
Building the Zhumadian-Wuhan 1000 kV double circuit line in 2023 - Photo Wang Cunfang Global TimesThere's no comparison between the UK and China though. If there's curtailment in China it's despite massive transmission upgrades because China's solar and wind roll-out has been so enormous. 5 and 6% are pretty low curtailment rates and probably aren't much to worry about for cheaply produced electricity.As you point out, the increase in curtailment is despite massive transmission upgrades.Bear in mind wind and solar accounted for only 18% of China’s generation in 2024. https://ember-energy.org/countries-and-regions/china/ Despite all the hype, China still lag the UK significantly in the proportion of generation from wind and solar. In the UK wind and solar accounted for 35% of generation in 2024 https://electricinsights.co.uk/#/dashboard?period=1-year&start=2024-01-01&&_k=vq2osq
2025 has seen a substantial increase in renewable generation in China and with it a 69% increase in curtailment, (as you point out, despite massive transmission upgrades). As wind and solar increase curtailment increases disproportionately. I wonder how much curtailment China will see as wind and solar hit 35%.Northern Lincolnshire. 7.8 kWp system, (4.2 kWwest facing panels , 3.6 kWeast facing), Solis inverters installed 2018, 5kW SSE facing system (shaded in afternoon) added in 2025 with Tesla PW3 battery, Mitsubishi SRK35ZS-S and SRK20ZS-S Wall Mounted A2A Heat Pumps, ex Nissan Leaf owner.0 -
What does solar cost to deploy in China? Around 1c per kWh? Even if you spill 50% of output that only pushes the cost of used kWh up to 2c!JKenH said:
You say:ed110220 said:
There's no comparison between the UK and China though. If there's curtailment in China it's despite massive transmission upgrades because China's solar and wind roll-out has been so enormous. 5 and 6% are pretty low curtailment rates and probably aren't much to worry about for cheaply produced electricity. China installed 212 GW of solar in the first half of this year. To put that in perspective the second-largest nation for solar capacity – the US – had only installed 178GW, in total, by the end of 2024, while third-ranked India had 98GW. Let that sink in - in half a year China installed more solar than the USA has ever installed!JKenH said:
Indeed, I’ve been saying that for years. Perhaps the present incumbents might think about prioritising storage and getting the grid sorted ahead of building any more wind or solar farms. Sadly, upgrading the grid isn’t half as sexy as adding generating capacity. Countries are judged by how much renewables capacity they add, not how effective it is.Netexporter said:Perhaps if previous governments had addressed the, blindingly obvious, need for storage, to even out intermittency/over-supply, there wouldn't be such a problem.
China has a similar problemChina's renewable power potential in far-flung provinces is increasingly going unused, official statistics showed on Monday, as the country rushes to build more long-distance transmission and energy storage to bridge the gap.The curtailment rate for solar power rose to 6.6% in the first half of 2025 from 3.9% in the same period a year earlier while the rate for wind rose to 5.7% from 3%, according to the National New Energy Consumption Monitoring and Early Warning Center.
https://www.reuters.com/sustainability/climate-energy/chinas-renewable-capacity-soars-utilisation-lags-data-show-2025-08-05/
Britain's grid is basically the same as it was in the late 20th C, apart from the undersea interconnectors; China has built a whole ultra-high voltage transmission system like nothing else in the world in the last 15 years. China has built whole 1000 kV AC grids in that time - the UK and West-Central Europe max out at 400 kV. No other country has more than 765 kV AC. The amount of power that can be transmitted rises dramatically with increasing voltage while losses fall, making transmission over longer distances practical. They've also built or are building at least 27 long distance 800 kV or more DC links, the longest over 3000 km long.
Check out the Wikipedia page on ultra-high voltage electricity transmission in China
Also Open Infrastructure Map - bright blue is >750 kV AC, dark blue is HVDC/UHVDC. It's open source and users only seem to add lines once they appear in publicly available satellite imagery so many of the lines listed on Wikipedia don't even appear yet - again showing how quickly things are moving.
I don't read Mandarin but looking at translated Chinese media they seem to make quite a big thing of these schemes, boasting of how much electricity will be transmitted, the biggest in the world, the highest altitude installation etc.
1000 kV AC double circuit. The description says the towers are 100 m tall - the typical 400 kV pylons in the UK are less than 50 m tall, so would probably fit under the lowest arms of this giant.
Building the Zhumadian-Wuhan 1000 kV double circuit line in 2023 - Photo Wang Cunfang Global TimesThere's no comparison between the UK and China though. If there's curtailment in China it's despite massive transmission upgrades because China's solar and wind roll-out has been so enormous. 5 and 6% are pretty low curtailment rates and probably aren't much to worry about for cheaply produced electricity.As you point out, the increase in curtailment is despite massive transmission upgrades.Bear in mind wind and solar accounted for only 18% of China’s generation in 2024. https://ember-energy.org/countries-and-regions/china/ Despite all the hype, China still lag the UK significantly in the proportion of generation from wind and solar. In the UK wind and solar accounted for 35% of generation in 2024 https://electricinsights.co.uk/#/dashboard?period=1-year&start=2024-01-01&&_k=vq2osq
2025 has seen a substantial increase in renewable generation in China and with it a 69% increase in curtailment, (as you point out, despite massive transmission upgrades). As wind and solar increase curtailment increases disproportionately. I wonder how much curtailment China will see as wind and solar hit 35%.I think....1 -
Around 3.3c/kWh in 2024 but China is now moving to a CfD based system linked to the cost of coal generation.michaels said:
What does solar cost to deploy in China? Around 1c per kWh? Even if you spill 50% of output that only pushes the cost of used kWh up to 2c!JKenH said:
You say:ed110220 said:
There's no comparison between the UK and China though. If there's curtailment in China it's despite massive transmission upgrades because China's solar and wind roll-out has been so enormous. 5 and 6% are pretty low curtailment rates and probably aren't much to worry about for cheaply produced electricity. China installed 212 GW of solar in the first half of this year. To put that in perspective the second-largest nation for solar capacity – the US – had only installed 178GW, in total, by the end of 2024, while third-ranked India had 98GW. Let that sink in - in half a year China installed more solar than the USA has ever installed!JKenH said:
Indeed, I’ve been saying that for years. Perhaps the present incumbents might think about prioritising storage and getting the grid sorted ahead of building any more wind or solar farms. Sadly, upgrading the grid isn’t half as sexy as adding generating capacity. Countries are judged by how much renewables capacity they add, not how effective it is.Netexporter said:Perhaps if previous governments had addressed the, blindingly obvious, need for storage, to even out intermittency/over-supply, there wouldn't be such a problem.
China has a similar problemChina's renewable power potential in far-flung provinces is increasingly going unused, official statistics showed on Monday, as the country rushes to build more long-distance transmission and energy storage to bridge the gap.The curtailment rate for solar power rose to 6.6% in the first half of 2025 from 3.9% in the same period a year earlier while the rate for wind rose to 5.7% from 3%, according to the National New Energy Consumption Monitoring and Early Warning Center.
https://www.reuters.com/sustainability/climate-energy/chinas-renewable-capacity-soars-utilisation-lags-data-show-2025-08-05/
Britain's grid is basically the same as it was in the late 20th C, apart from the undersea interconnectors; China has built a whole ultra-high voltage transmission system like nothing else in the world in the last 15 years. China has built whole 1000 kV AC grids in that time - the UK and West-Central Europe max out at 400 kV. No other country has more than 765 kV AC. The amount of power that can be transmitted rises dramatically with increasing voltage while losses fall, making transmission over longer distances practical. They've also built or are building at least 27 long distance 800 kV or more DC links, the longest over 3000 km long.
Check out the Wikipedia page on ultra-high voltage electricity transmission in China
Also Open Infrastructure Map - bright blue is >750 kV AC, dark blue is HVDC/UHVDC. It's open source and users only seem to add lines once they appear in publicly available satellite imagery so many of the lines listed on Wikipedia don't even appear yet - again showing how quickly things are moving.
I don't read Mandarin but looking at translated Chinese media they seem to make quite a big thing of these schemes, boasting of how much electricity will be transmitted, the biggest in the world, the highest altitude installation etc.
1000 kV AC double circuit. The description says the towers are 100 m tall - the typical 400 kV pylons in the UK are less than 50 m tall, so would probably fit under the lowest arms of this giant.
Building the Zhumadian-Wuhan 1000 kV double circuit line in 2023 - Photo Wang Cunfang Global TimesThere's no comparison between the UK and China though. If there's curtailment in China it's despite massive transmission upgrades because China's solar and wind roll-out has been so enormous. 5 and 6% are pretty low curtailment rates and probably aren't much to worry about for cheaply produced electricity.As you point out, the increase in curtailment is despite massive transmission upgrades.Bear in mind wind and solar accounted for only 18% of China’s generation in 2024. https://ember-energy.org/countries-and-regions/china/ Despite all the hype, China still lag the UK significantly in the proportion of generation from wind and solar. In the UK wind and solar accounted for 35% of generation in 2024 https://electricinsights.co.uk/#/dashboard?period=1-year&start=2024-01-01&&_k=vq2osq
2025 has seen a substantial increase in renewable generation in China and with it a 69% increase in curtailment, (as you point out, despite massive transmission upgrades). As wind and solar increase curtailment increases disproportionately. I wonder how much curtailment China will see as wind and solar hit 35%.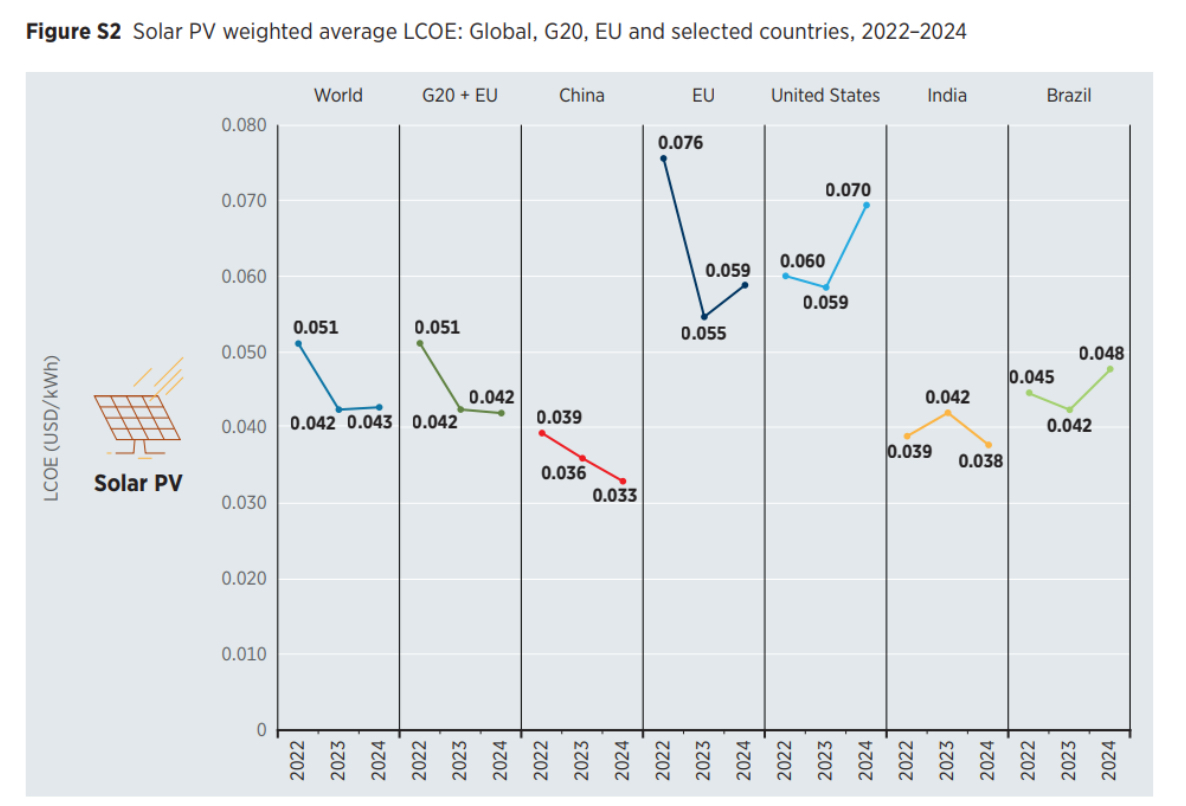 Northern Lincolnshire. 7.8 kWp system, (4.2 kWwest facing panels , 3.6 kWeast facing), Solis inverters installed 2018, 5kW SSE facing system (shaded in afternoon) added in 2025 with Tesla PW3 battery, Mitsubishi SRK35ZS-S and SRK20ZS-S Wall Mounted A2A Heat Pumps, ex Nissan Leaf owner.2
 -
Interesting article in New Scientist.
Air cleanup sparks climate surprisesGlobal action to improve air quality – by shutting down coal-fired power stations and cleaning up shipping fuels – has saved millions of lives in recent decades. But on the flip side, air pollution can also cool the planet. Removing it has released a surge of warming that has warped the weather around the world.Climate scientists have known about this cooling effect since the 1970s. It has helped to dampen the warming effect of greenhouse gas emissions by about 0.5°C, they estimate – although uncertainty ranges are large.
So it isn’t surprising that our efforts to improve air quality have come with a side order of extra global warming. Actions to reduce pollution in East Asia alone account for 5 per cent of global temperature increase since 1850, a study published earlier this year shows.
Unsurprisingly, some of the biggest shifts have emerged in China. In 2022, mainland heatwaves in eastern China were up to 0.5°C more intense because of the country’s clean air improvements. But there are also strange “teleconnections”, a term used in climate science to refer to when a change in one part of the world triggers a climatic shift tens of thousands of kilometres away. The sudden emergence of severe ocean heatwaves, dubbed “warm blobs”, in the Pacific Ocean near Alaska over the past decade could be another result of China’s aerosol pollution reductions.
While the most extreme changes are regional, the rapid abatement of aerosol pollution has also had a global impact on the pace of warming. Yuan’s 2024 research suggests the IMO shipping regulations could lead to a doubling (or more) of the warming rate of the global ocean in the 2020s compared with the rate since 1980. This would mean further record-breaking global temperatures could be in store this decade.
https://go.readly.com/articles/68c1d1d4ce8c05d33011ea0b?origin=app
Northern Lincolnshire. 7.8 kWp system, (4.2 kWwest facing panels , 3.6 kWeast facing), Solis inverters installed 2018, 5kW SSE facing system (shaded in afternoon) added in 2025 with Tesla PW3 battery, Mitsubishi SRK35ZS-S and SRK20ZS-S Wall Mounted A2A Heat Pumps, ex Nissan Leaf owner.4 -
There have occasionally been proposals to intentionally inject particles into the upper atmosphere as a geoengineering approach to dimming sunlight and slowing global warming.So far the economics and politics haven't favoured them, but if we're looking overshoot the temperature targets then maybe we'll have to resort to something drastic like that.Or maybe we'll get another good-sized volcanic eruption that'll throw enough dust up there without human intervention.N. Hampshire, he/him. Octopus Intelligent Go elec & Tracker gas / Vodafone BB / iD mobile. Kirk Hill Co-op member.Ofgem cap table, Ofgem cap explainer. Economy 7 cap explainer. Gas vs E7 vs peak elec heating costs, Best kettle!
2.72kWp PV facing SSW installed Jan 2012. 11 x 247w panels, 3.6kw inverter. 37 MWh generated, long-term average 2.6 Os.0 -
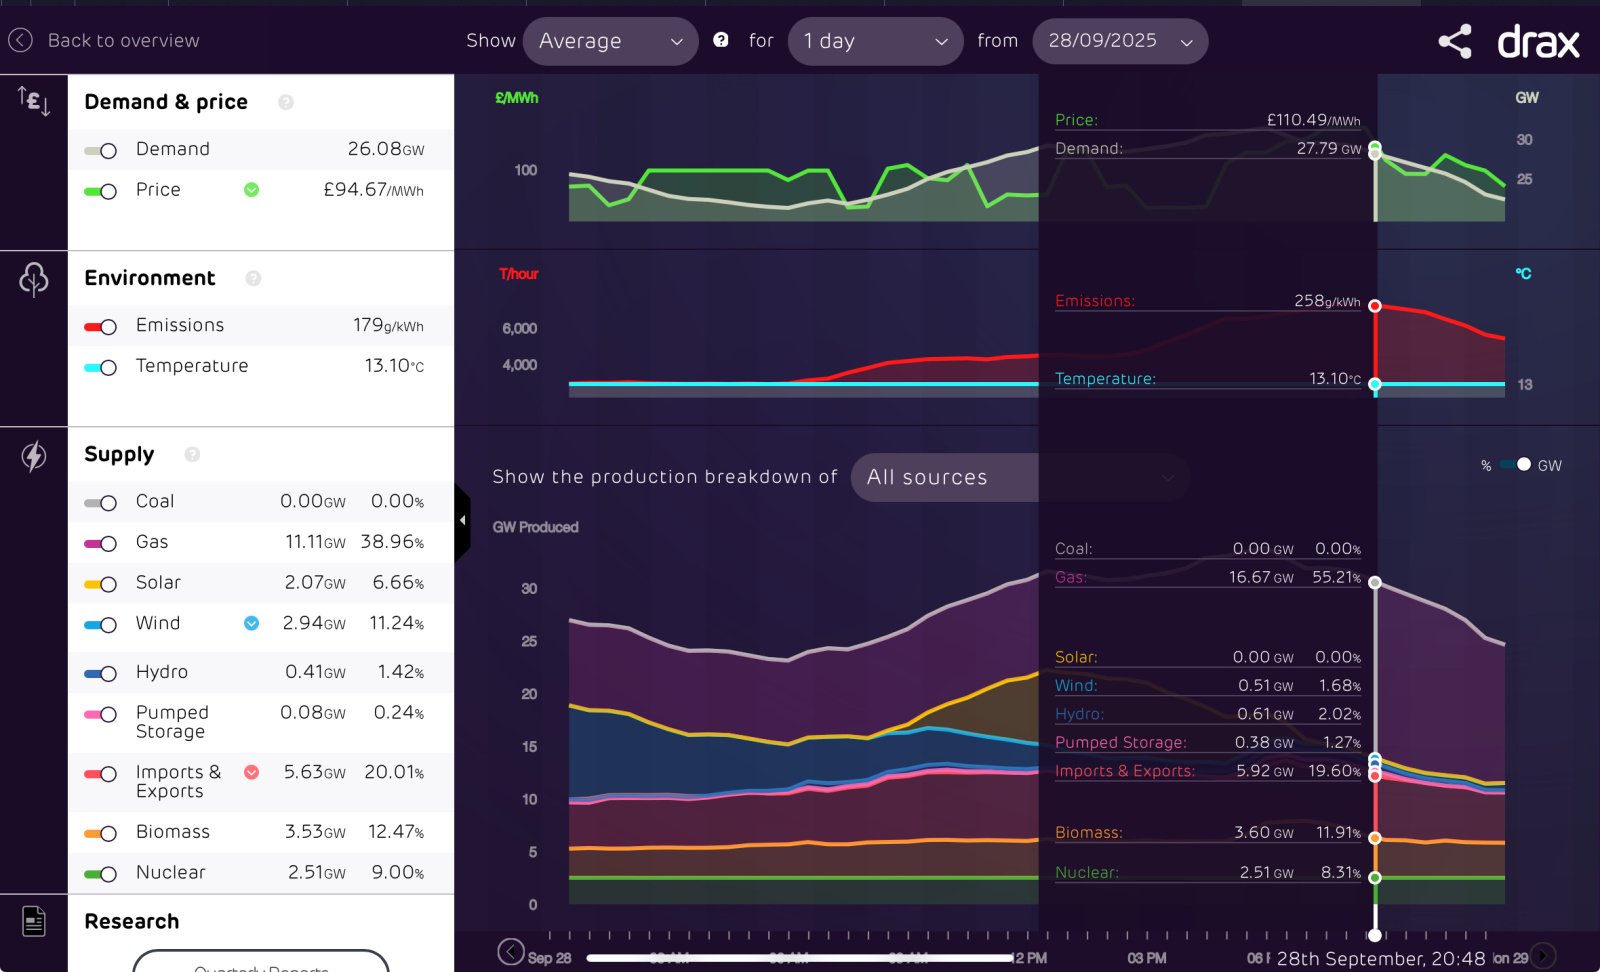
For 12 hours overnight, approx 7am to 7pm, on 28th/29th September renewables contributed 2GW or less of generation, the low point being just 0.51 GW.
Northern Lincolnshire. 7.8 kWp system, (4.2 kWwest facing panels , 3.6 kWeast facing), Solis inverters installed 2018, 5kW SSE facing system (shaded in afternoon) added in 2025 with Tesla PW3 battery, Mitsubishi SRK35ZS-S and SRK20ZS-S Wall Mounted A2A Heat Pumps, ex Nissan Leaf owner.1 -
JKenH said:For 12 hours overnight, approx 7am to 7pm, on 28th/29th September renewables contributed 2GW or less of generation, the low point being just 0.51 GW.This episode of 'cleaning up' had an interesting discussion on why 95 % renewables is doable. The last 5% more difficult.Picking a short period such as this one isn't particularly insightful though.
4.7kwp PV split equally N and S 20° 2016.Givenergy AIO (2024)Seat Mii electric (2021). MG4 Trophy (2024).1.2kw Ripple Kirk Hill. 0.6kw Derril Water.Vaillant aroTHERM plus 5kW ASHP (2025)Gas supply capped (2025)1 -
JKenH said:For 12 hours overnight, approx 7am to 7pm, on 28th/29th September renewables contributed 2GW or less of generation, the low point being just 0.51 GW.I guess that depends on whether you count hydro (0.61GW) and biomass (3.60GW) as being renewables?An alternative reading of that same graph would be "even in a windless night, we could meet almost half our electricity demand without burning gas".In contrast I offer the 15th of September, when barely 10% of our electricity (~75GWh) came from gas ...... and we could have got at least half of that from Scotland if we'd built the interconnectors already:N. Hampshire, he/him. Octopus Intelligent Go elec & Tracker gas / Vodafone BB / iD mobile. Kirk Hill Co-op member.Ofgem cap table, Ofgem cap explainer. Economy 7 cap explainer. Gas vs E7 vs peak elec heating costs, Best kettle!
2.72kWp PV facing SSW installed Jan 2012. 11 x 247w panels, 3.6kw inverter. 37 MWh generated, long-term average 2.6 Os.3 -
You do understand that 'net' in net zero does a lot of the heavy lifting don't you? The plan is to offset fossil fuel usage during RE lows with renewable exports during RE over production periods. It is amazing how many intelligent people fail to understand this when discussing the issue.JKenH said:For 12 hours overnight, approx 7am to 7pm, on 28th/29th September renewables contributed 2GW or less of generation, the low point being just 0.51 GW.I think....0 -
Gas generation has actually increased in the last 12 months and is 12% higher than the combined gas and coal figure of the previous year. Total generation has increased by 1.7%. Gas generation accounted for 28.44% of total generation in the last 12 months compared to 25.86% (gas and coal) in the previous 12 months. Whatever the plan is, it isn’t working too well.
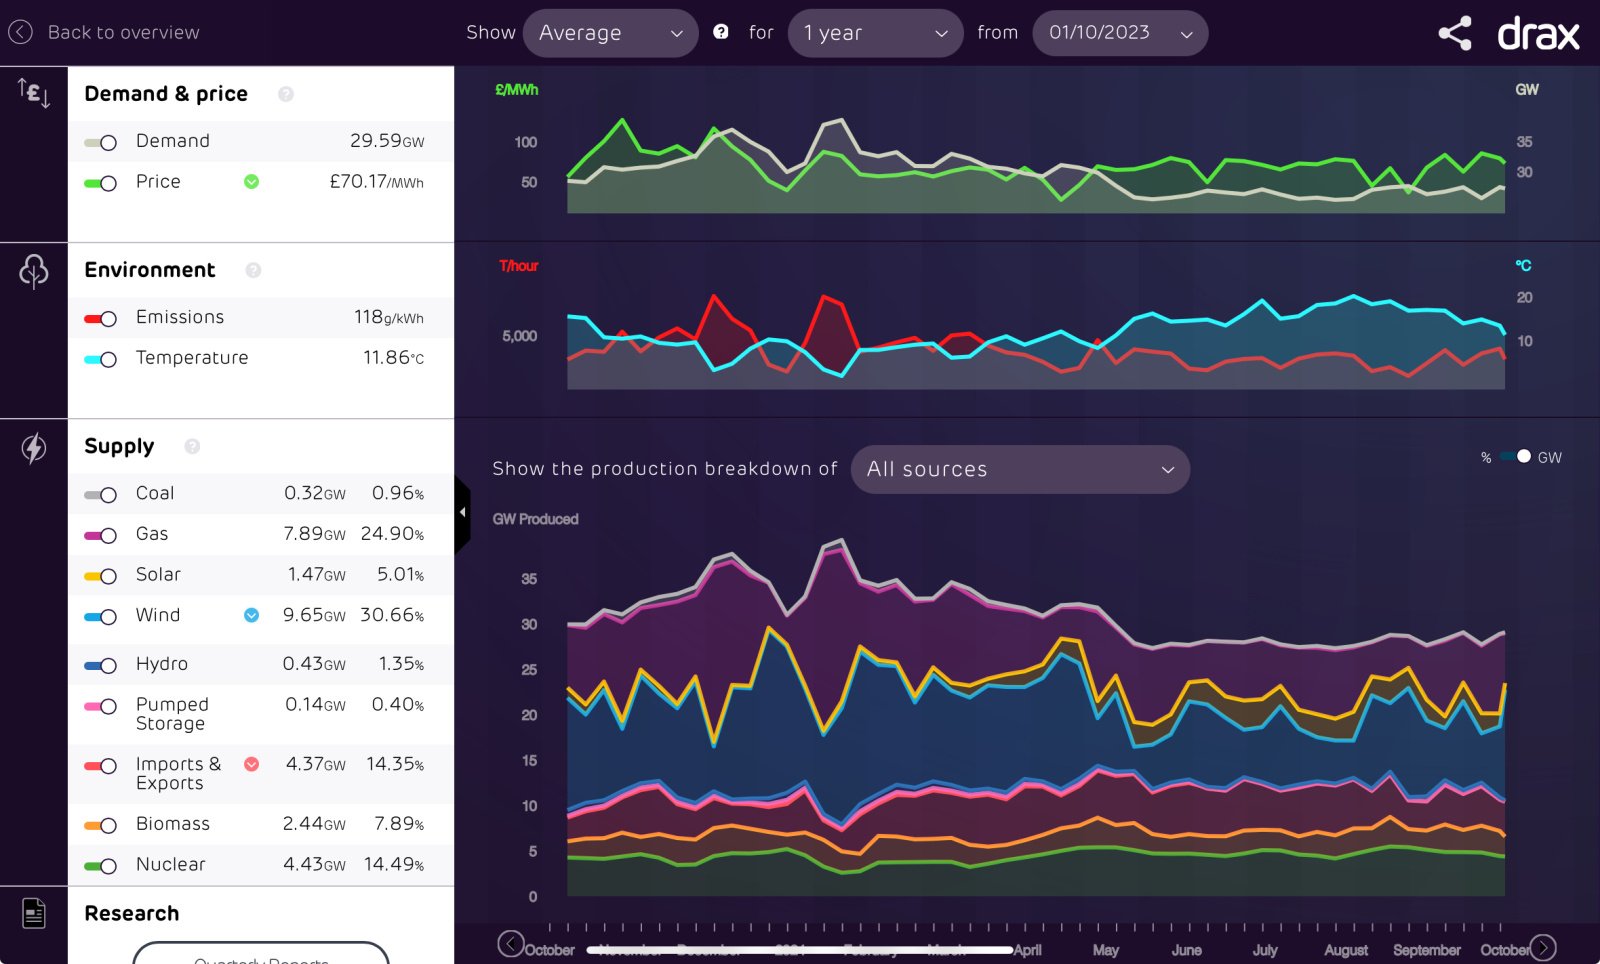
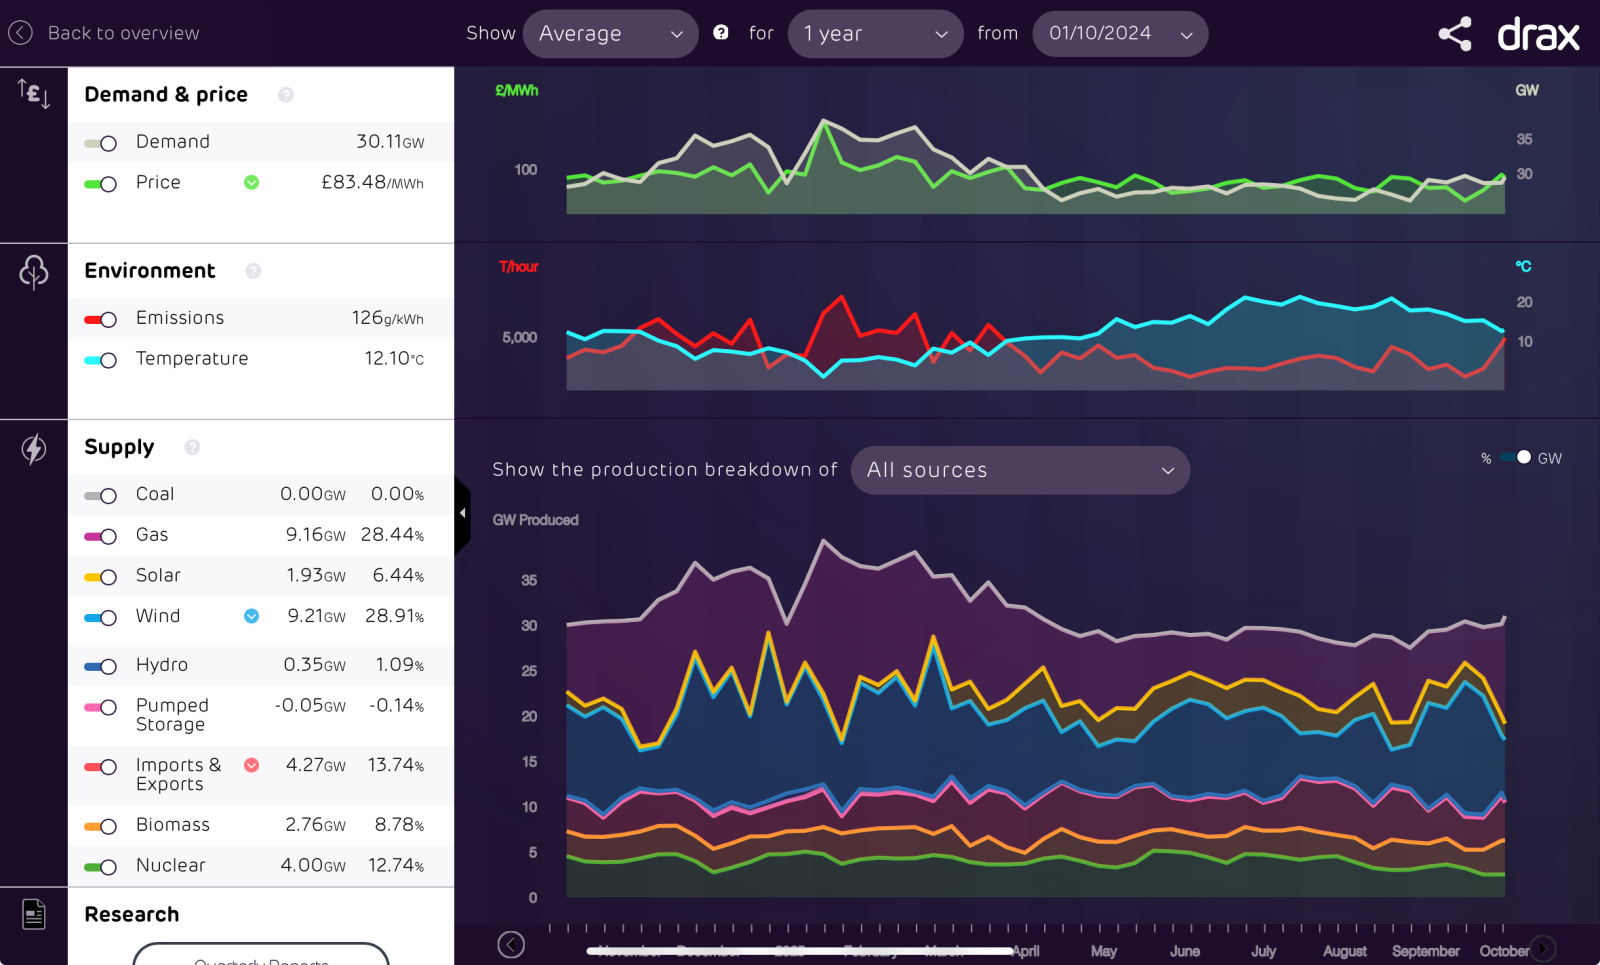 Northern Lincolnshire. 7.8 kWp system, (4.2 kWwest facing panels , 3.6 kWeast facing), Solis inverters installed 2018, 5kW SSE facing system (shaded in afternoon) added in 2025 with Tesla PW3 battery, Mitsubishi SRK35ZS-S and SRK20ZS-S Wall Mounted A2A Heat Pumps, ex Nissan Leaf owner.0


 https://youtu.be/UtsCCJ4o1WA?si=z6AnSiXePFOdxlTR
Confirm your email address to Create Threads and Reply

Categories
- All Categories
- 355.2K Banking & Borrowing
- 254.7K Reduce Debt & Boost Income
- 455.8K Spending & Discounts
- 247.9K Work, Benefits & Business
- 605K Mortgages, Homes & Bills
- 178.8K Life & Family
- 262.8K Travel & Transport
- 1.5M Hobbies & Leisure
- 16.1K Discuss & Feedback
- 37.7K Read-Only Boards