We’d like to remind Forumites to please avoid political debate on the Forum.
This is to keep it a safe and useful space for MoneySaving discussions. Threads that are – or become – political in nature may be removed in line with the Forum’s rules. Thank you for your understanding.
📨 Have you signed up to the Forum's new Email Digest yet? Get a selection of trending threads sent straight to your inbox daily, weekly or monthly!
The Forum now has a brand new text editor, adding a bunch of handy features to use when creating posts. Read more in our how-to guide
Merry Correction Day
Comments
-
the 2.85% is so close to natural yield I do wonder if it would be worth maintaining a fairly high investment risk until retirement and trying to live off dividends
I don't think I've ever seen a plot of dividend rates (preferably corrected for inflation) on, say, US shares, over many decades. But the data must exist because people calculate total return i.e. share price return modified by reinvestment of dividends.
Can anyone point me to a good source for the US or UK?Free the dunston one next time too.0 -
I don't think I've ever seen a plot of dividend rates (preferably corrected for inflation) on, say, US shares, over many decades. But the data must exist because people calculate total return i.e. share price return modified by reinvestment of dividends.
Can anyone point me to a good source for the US or UK?
Interesting - it looks like there are years where the dividends are significantly outpaced by inflation.
Still these are % dividends of presumabley increasing share prices.
http://www.simplestockinvesting.com/images/SP500_dividend_inflation.png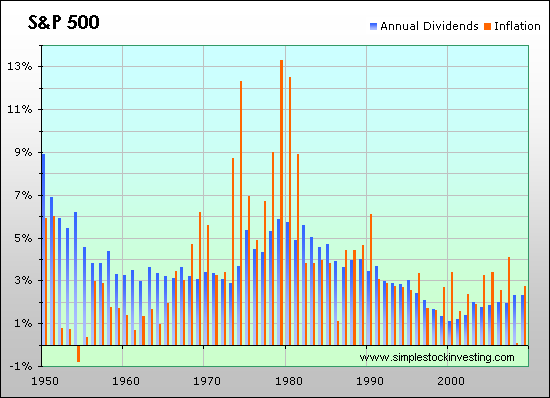 0
0 -
Interesting - it looks like there are years where the dividends are significantly outpaced by inflation.
Still these are % dividends of presumabley increasing share prices.
http://www.simplestockinvesting.com/images/SP500_dividend_inflation.png
I must have misunderstood something but that graph seems to provide a totally meaningless comparison. Dividend % Is against the share price now. Inflation % is the increase in prices as a % of their level 1 year ago. Why should there be any link?
Very broadly nflation can be seen as a measure of the decrease in the value of money against other things. So you would expect share prices to rise in value with inflation. Dividends in cash terms should also rise with inflation but the dividend as a% of the share price is something quite different.0 -
I must have misunderstood something but that graph seems to provide a totally meaningless comparison. Dividend % Is against the share price now. Inflation % is the increase in prices as a % of their level 1 year ago. Why should there be any link?
Very broadly nflation can be seen as a measure of the decrease in the value of money against other things. So you would expect share prices to rise in value with inflation. Dividends in cash terms should also rise with inflation but the dividend as a% of the share price is something quite different.
I'm guessing the chart shows dividends at fixed points in the year hence the very low 1% in the year 2000. That 1% will be a value of the SP 500 at a high point.
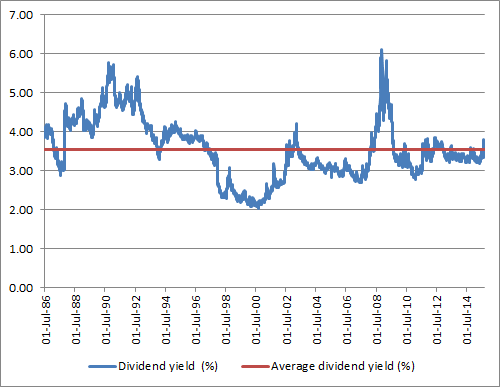
The same can be seen in the UK yield chart below. The year 2000 the FTSE yield was 2% at the high point.
https://dzexi57u5vx1h.cloudfront.net/images/investment-insight/2015/Sep-2015/22-9-15/22-09-2015-Chart1.png0 -
-
30 years isn't very long when there is a circa 1 in 10 chance of living to 100.
My plan is 1/35th drawdown 2.86% from age 58 plus an extra £9k per year for the first 10 years to cover the missing state pension. I would obviously derisk the £90k as I aproached retirement but the 2.85% is so close to natural yield I do wonder if it would be worth maintaining a fairly high investment risk until retirement and trying to live off dividends (making occasional unit sales when markets are high) which might significantly reduce risk in my plan.
Alex
Could take the natural yield in UK based funds as it's generally been above 3% for decades.
https://www.schroders.com/en/insights/economics/outlook-2019-uk-equities/
https://pbs.twimg.com/media/DudrvbOW0AA3naf.jpg0 -
What we need is this:
(i) We pretend somebody invested, say, $1000 in the S&P 500 in some year long ago. Someone then plots the dividend he'd get every year, in cents, allowing for the entries and exits from the index, and assuming that all the dividends are withdrawn, not reinvested.
(ii) A second line on the plot might show US annual CPI inflation year after year.
(iii) The third line on the plot would be the inflation-corrected dividend year after year.
I must say I have no idea what such a third line would look like but it's surely what believers in harvesting "the natural yield" must want to see? In fact, wouldn't it rather useful to many retirees whatever their own particular scheme for drawing down from their pensions? Corresponding plots for the FTSE100 and FTSE250 might be useful too.
N.B. By a universally agreed convention, one plots share performance measures only for the US and UK. One never lets people see how disappointing equity investment has often been over the decades in many other developed countries.Free the dunston one next time too.0 -
Just updated my pension spreadsheets for the final quarter, 6% down from September. But I am in fairly low risk funds. 1% down overall since I took a couple of high CETVs. Be interesting to hear what my IFA says in April but not overly worried just yet. 4 years and 3 months to retirement :rudolf:0
-
What we need is this:
(i) We pretend somebody invested, say, $1000 in the S&P 500 in some year long ago. Someone then plots the dividend he'd get every year, in cents, allowing for the entries and exits from the index, and assuming that all the dividends are withdrawn, not reinvested.
(ii) A second line on the plot might show US annual CPI inflation year after year.
(iii) The third line on the plot would be the inflation-corrected dividend year after year.
I must say I have no idea what such a third line would look like but it's surely what believers in harvesting "the natural yield" must want to see? In fact, wouldn't it rather useful to many retirees whatever their own particular scheme for drawing down from their pensions? Corresponding plots for the FTSE100 and FTSE250 might be useful too.
N.B. By a universally agreed convention, one plots share performance measures only for the US and UK. One never lets people see how disappointing equity investment has often been over the decades in many other developed countries.
S&P 500
https://seekingalpha.com/article/439171-has-dividend-growth-kept-up-with-inflation
https://seekingalpha.com/article/259124-do-dividend-increases-keep-up-with-inflation
https://www.dividend.com/how-to-invest/dividends-an-inflation-hedge/
FTSE
FTSE 100 was formed in 1984 with a base of 1000 and a dividend yield around 4%. So a £40 dividend today would be £130 allowing for inflation. Today the FTSE stands at 6720 yielding 4.5% which is around £302. From the all time high 6900 in year 2000 with the very low yield of 2% you would have a return of £140. Today that inflated figure would be £230. The FTSE yields £302 today. From that if you'd been investing from 1984 dividends have faired well. Even from the worst period 2000-2018 you'd still be doing ok.
https://www.thisismoney.co.uk/money/bills/article-1633409/Historic-inflation-calculator-value-money-changed-1900.html
https://www.ukvalueinvestor.com/wp-content/uploads/2015/05/FTSE-100-Dividend-yield-over-30-years-2015-05.png
https://dzexi57u5vx1h.cloudfront.net/images/investment-insight/2015/Sep-2015/22-9-15/22-09-2015-Chart1.png0 -
Could take the natural yield in UK based funds as it's generally been above 3% for decades.
https://www.schroders.com/en/insights/economics/outlook-2019-uk-equities/
https://pbs.twimg.com/media/DudrvbOW0AA3naf.jpg
Works as long as stock prices also increase as fast as the price level.I think....0


This discussion has been closed.
Confirm your email address to Create Threads and Reply

Categories
- All Categories
- 354.4K Banking & Borrowing
- 254.4K Reduce Debt & Boost Income
- 455.4K Spending & Discounts
- 247.3K Work, Benefits & Business
- 604K Mortgages, Homes & Bills
- 178.4K Life & Family
- 261.5K Travel & Transport
- 1.5M Hobbies & Leisure
- 16K Discuss & Feedback
- 37.7K Read-Only Boards