We’d like to remind Forumites to please avoid political debate on the Forum.
This is to keep it a safe and useful space for MoneySaving discussions. Threads that are – or become – political in nature may be removed in line with the Forum’s rules. Thank you for your understanding.
📨 Have you signed up to the Forum's new Email Digest yet? Get a selection of trending threads sent straight to your inbox daily, weekly or monthly!
The Forum now has a brand new text editor, adding a bunch of handy features to use when creating posts. Read more in our how-to guide
What % of your Solar PV generation do you actually use, on average?
Comments
-
I posted this thread https://forums.moneysavingexpert.com/discussion/5471656 a while back on the same theme - apologies but the links no longer work to view the "pretty graphical displays" of my generation v use/export etc.
For 2016 my export was 30% - but again, that is net of diverting to hot water and radiators.
And I expect that to rise a little this year because I have replaced the kitchen white goods with A+++ as part of the new kitchen project, so during generation hours am using a little less and exporting more, so might sneak up to 32% export perhaps0 -
My export runs at about 33% on an annual basis and I divert >1000 units to hot water a year and, having added an additional jacket to the built in insulation this summer it will be interesting to see what that achieves. I hope to extend my season a little bit. (PS: A very occasional use of a fan heater in the shoulder months when I am there to actively monitor and switch).
I live alone so that must make a difference compared to many on here. Only myself to discipline or blame most of the time except when my GF visits, I'm trying to get her not to fill the kettle everytime!0 -
I've managed to get some monthly results from the MyImmersun app. Afraid their generation figures don't seem very accurate when compared with TGM results but I suppose they're 'in the right parish'.
MonthTGM resultsImm Gen FigImm Exp fig%Exp from ImmAug-16473439.317.33.9Sep-1633835112.93.7Oct-16220224.78.73.9Nov-16117119.532.5Dec-16737322.7Jan-177473.51.92.6Feb-171301474.73.2Mar-17337345.212.53.6Apr-17425447.420.34.5May-17508521.320.53.9Jun-17456485.727.25.6Jul-17471482.725.25.2 Ann Ave: 3.8
Afraid my neat table got destroyed by the MSE posting process ! I'll try and add it as a picture later. Important thing is that the average of the 12 monthly export figures is 3.8%. Hence annual %ge of generation used must be around 96%.
http://www.khormaksarschool.org.uk/SolarPanels/AnnExpPercentage.jpg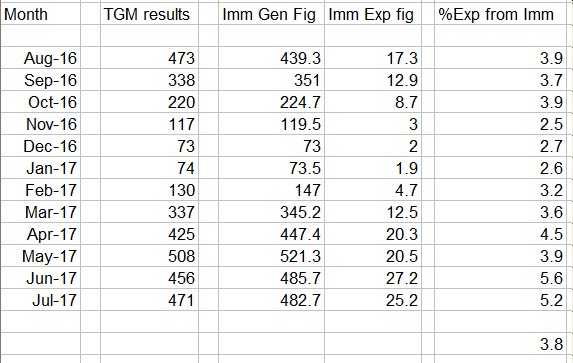
NE Derbyshire.4kWp S Facing 17.5deg slope (dormer roof).24kWh of Pylontech batteries with Lux controller BEV : Hyundai Ioniq50 -
Our usage of generated energy is above 82%. An accurate export figure is provided by the Smart Meter. Ovo has this figure read by a meter reader annually. The export figure is not read remotely by Ovo: their system appears not to have that flexibility. Daytime Base load is negated to an extent during the low generation months. Otherwise laundry appliances provide a substantial load.I have osteoarthritis in my hands so I speak my messages into a microphone using Dragon. Some people make "typos" but I often make "speakos".0


This discussion has been closed.
Confirm your email address to Create Threads and Reply

Categories
- All Categories
- 354.6K Banking & Borrowing
- 254.5K Reduce Debt & Boost Income
- 455.5K Spending & Discounts
- 247.5K Work, Benefits & Business
- 604.4K Mortgages, Homes & Bills
- 178.6K Life & Family
- 261.9K Travel & Transport
- 1.5M Hobbies & Leisure
- 16.1K Discuss & Feedback
- 37.7K Read-Only Boards