We’d like to remind Forumites to please avoid political debate on the Forum.
This is to keep it a safe and useful space for MoneySaving discussions. Threads that are – or become – political in nature may be removed in line with the Forum’s rules. Thank you for your understanding.
📨 Have you signed up to the Forum's new Email Digest yet? Get a selection of trending threads sent straight to your inbox daily, weekly or monthly!
Drawdown: safe withdrawal rates
Comments
-
Interestingly, Pfau (https://retirementresearcher.com/4-rule-work-around-world/ ) says that “In terms of the SAFEMAX, 50% stocks and 50% bills generally outperforms 50% stocks and 50% bonds in the dataset. For bonds, the additional returns over bills failed to compensate for their additional volatility in a retirement income plan …”Prism said:
I would say that is because normally bonds would be expected to do the heavy lifting during equity downturns and they paid a better return at the same time. As it stands cash, including savings accounts offers a better return than bonds and is lower risk. Hence the frequent talk of x number of years in cash as a buffer. Historically a cash buffer was never needed but maybe now cash is better than bonds - at least until QE ends.bostonerimus said:The mathematical models used to derive withdrawal rates can use whatever asset allocation you like, however, I've never seen them include cash. They usually use broad US stock and bond indexes in varying percentages.
Using the annual returns data from the JST Macrohistory dataset (https://www.macrohistory.net) I plotted the SWR obtained over a 30 year retirement period for all starting years using US stocks and bills, i.e. SWR(Bills) as a function of the SWR obtained using stocks and bonds, i.e. SWR(Bonds) (60% stocks in both cases) in the top panel of the following figure. In the bottom panel, the difference between the SWR with bills and the SWR with bonds is plotted as a function of the SWR obtained with bonds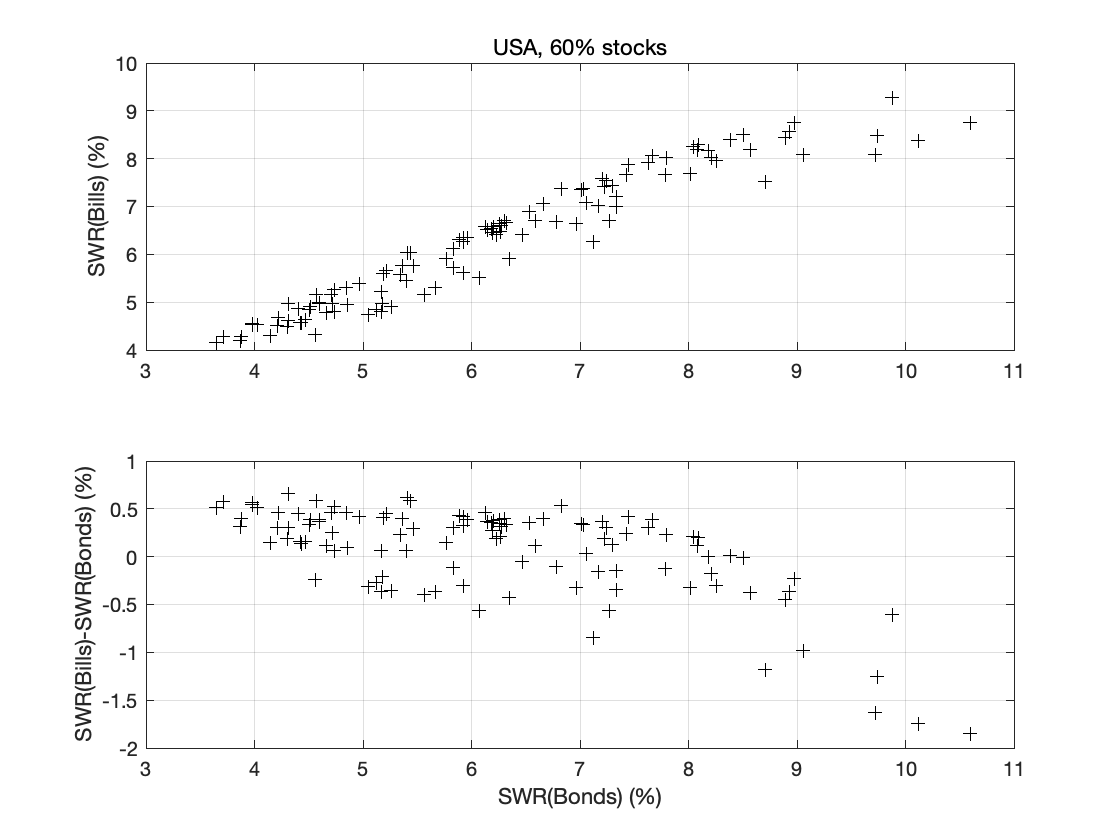
The bottom panel is probably the most illuminating - historically, using bills produced a higher SWR in cases where the SWR was low (below about 4.5%) and a much worse performance when the SWR was high (greater than about 9%). Between these values the performance was mixed.
For the UK, the equivalent graph looked like this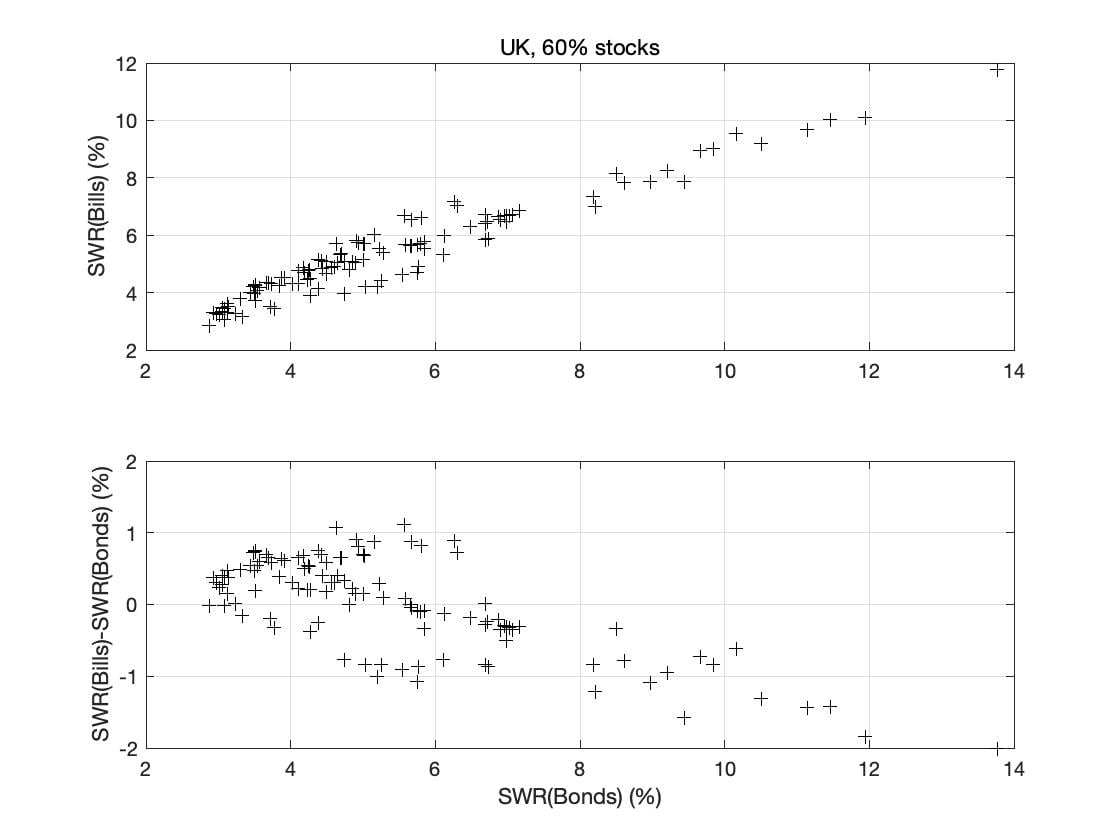
Again, there was a definite trend, but there were cases when the SWR is low, where using bills didn't give any significant advantage over using bonds. For good retirements (SWR higher than 6.5%) bills always underperformed bonds.
I also looked at the other countries in the JST database, but won't bore people with the results except to say that some countries (e.g. Germany, France, Italy, and Japan) generally showed the opposite outcome, i.e. they had a worse performance with bills than with bonds at low SWR.
I also note that I've used bills as a proxy for cash, but as retail investors/savers, we are currently able to get much better interest rates (e.g. in a 1 year fixed rate savings account) than with the more liquid bills. Does anyone know of a database of historical retail interest rates on saving accounts (preferably for the UK)? The archives of MSE only go back so far, while the rate at https://www.bsa.org.uk/BSA/files/5c/5c180498-5e52-4a41-b022-5821c25f3cbd.pdf are patchy before 1950 and (as far as I can tell) only cover retail personal deposits (instant access?).2 -
Nice analysis. I assume by "bills" you mean government bonds. It's interesting that boring old government bonds seem to do better than the wider bond markets in the US and the UK for reasonable withdrawal rates, but I think the original question was a bit simpler and involved what assets to include in a SWR rule of thumb estimate. Traditionally cash would not be included and many US estimates would have used T-bills rather than the larger bond markets. However, I think the biggest problem for SWR right now is inflation and maybe some systemic cost of living increases that will come as energy usage changes. I think this makes the budgeting and spending control side of the equation even more important.OldScientist said:
Interestingly, Pfau (https://retirementresearcher.com/4-rule-work-around-world/ ) says that “In terms of the SAFEMAX, 50% stocks and 50% bills generally outperforms 50% stocks and 50% bonds in the dataset. For bonds, the additional returns over bills failed to compensate for their additional volatility in a retirement income plan …”Prism said:
I would say that is because normally bonds would be expected to do the heavy lifting during equity downturns and they paid a better return at the same time. As it stands cash, including savings accounts offers a better return than bonds and is lower risk. Hence the frequent talk of x number of years in cash as a buffer. Historically a cash buffer was never needed but maybe now cash is better than bonds - at least until QE ends.bostonerimus said:The mathematical models used to derive withdrawal rates can use whatever asset allocation you like, however, I've never seen them include cash. They usually use broad US stock and bond indexes in varying percentages.
Using the annual returns data from the JST Macrohistory dataset (https://www.macrohistory.net) I plotted the SWR obtained over a 30 year retirement period for all starting years using US stocks and bills, i.e. SWR(Bills) as a function of the SWR obtained using stocks and bonds, i.e. SWR(Bonds) (60% stocks in both cases) in the top panel of the following figure. In the bottom panel, the difference between the SWR with bills and the SWR with bonds is plotted as a function of the SWR obtained with bonds
The bottom panel is probably the most illuminating - historically, using bills produced a higher SWR in cases where the SWR was low (below about 4.5%) and a much worse performance when the SWR was high (greater than about 9%). Between these values the performance was mixed.
For the UK, the equivalent graph looked like this
Again, there was a definite trend, but there were cases when the SWR is low, where using bills didn't give any significant advantage over using bonds. For good retirements (SWR higher than 6.5%) bills always underperformed bonds.
I also looked at the other countries in the JST database, but won't bore people with the results except to say that some countries (e.g. Germany, France, Italy, and Japan) generally showed the opposite outcome, i.e. they had a worse performance with bills than with bonds at low SWR.
I also note that I've used bills as a proxy for cash, but as retail investors/savers, we are currently able to get much better interest rates (e.g. in a 1 year fixed rate savings account) than with the more liquid bills. Does anyone know of a database of historical retail interest rates on saving accounts (preferably for the UK)? The archives of MSE only go back so far, while the rate at https://www.bsa.org.uk/BSA/files/5c/5c180498-5e52-4a41-b022-5821c25f3cbd.pdf are patchy before 1950 and (as far as I can tell) only cover retail personal deposits (instant access?).“So we beat on, boats against the current, borne back ceaselessly into the past.”0 -
There is no such thing as a 'safe' withdrawal rate. If there is one, it would stupidly low, like 1% or maybe 2% at the most. You have to assume that your pot will eventually run out, so with what is left aim to buy an annuity at age 75 when you can receive a reasonable rate, especially if you have a serious illness at that age.0
-
They mean bills as in T-Bills to represent cash. I believe that the reason cash could help raise the historical SWR at least for the US is that during the worst starting time period of the late 1960s cash had some of the strongest returns over bonds and equities. So that would increase the SWR over that otherwise poor time period.bostonerimus said:
Nice analysis. I assume by "bills" you mean government bonds. It's interesting that boring old government bonds seem to do better than the wider bond markets in the US and the UK for reasonable withdrawal rates, but I think the original question was a bit simpler and involved what assets to include in a SWR rule of thumb estimate. Traditionally cash would not be included and many US estimates would have used T-bills rather than the larger bond markets. However, I think the biggest problem for SWR right now is inflation and maybe some systemic cost of living increases that will come as energy usage changes. I think this makes the budgeting and spending control side of the equation even more important.1 -
T-bills are not cash though, they have a coupon. I suppose they might stand in for cash in a saving account, but cash held in a regular bank account with no interest should not be included in SWR estimates.Prism said:
They mean bills as in T-Bills to represent cash. I believe that the reason cash could help raise the historical SWR at least for the US is that during the worst starting time period of the late 1960s cash had some of the strongest returns over bonds and equities. So that would increase the SWR over that otherwise poor time period.bostonerimus said:
Nice analysis. I assume by "bills" you mean government bonds. It's interesting that boring old government bonds seem to do better than the wider bond markets in the US and the UK for reasonable withdrawal rates, but I think the original question was a bit simpler and involved what assets to include in a SWR rule of thumb estimate. Traditionally cash would not be included and many US estimates would have used T-bills rather than the larger bond markets. However, I think the biggest problem for SWR right now is inflation and maybe some systemic cost of living increases that will come as energy usage changes. I think this makes the budgeting and spending control side of the equation even more important.“So we beat on, boats against the current, borne back ceaselessly into the past.”0 -
I assume when people say 'cash' they are also typically getting interest too. I get interest on my current account, my instant access accounts, notice accounts and 1 year fixed accounts - all of which seem comparable to a T-Bill of up to 52 weeks.bostonerimus said:
T-bills are not cash though, they have a coupon. I suppose they might stand in for cash in a saving account, but cash held in a regular bank account with no interest should not be included in SWR estimates.Prism said:
They mean bills as in T-Bills to represent cash. I believe that the reason cash could help raise the historical SWR at least for the US is that during the worst starting time period of the late 1960s cash had some of the strongest returns over bonds and equities. So that would increase the SWR over that otherwise poor time period.bostonerimus said:
Nice analysis. I assume by "bills" you mean government bonds. It's interesting that boring old government bonds seem to do better than the wider bond markets in the US and the UK for reasonable withdrawal rates, but I think the original question was a bit simpler and involved what assets to include in a SWR rule of thumb estimate. Traditionally cash would not be included and many US estimates would have used T-bills rather than the larger bond markets. However, I think the biggest problem for SWR right now is inflation and maybe some systemic cost of living increases that will come as energy usage changes. I think this makes the budgeting and spending control side of the equation even more important.1 -
The safe withdrawal rate is only a guide, but a useful guide for those approaching retirement and going into drawdown. From the research done, I would think 3.5% would be reasonably safe, especially if you also hold a healthy cash buffer.mlv-1967 said:There is no such thing as a 'safe' withdrawal rate. If there is one, it would stupidly low, like 1% or maybe 2% at the most. You have to assume that your pot will eventually run out, so with what is left aim to buy an annuity at age 75 when you can receive a reasonable rate, especially if you have a serious illness at that age.
If you were only drawing 1% plus inflation annually, you could hold it all in cash and it would still last throughout a long retirement.
An annuity at 75 is an option, but for someone with a serious illness and not long left, I think it would be better to keep the money invested for the benefit of their spouse.0 -
Bills means US Treasury bills with duration normally at one year rather than the normally used longer term bonds. It's a cash proxy.Nice analysis. I assume by "bills" you mean government bonds.
Further analysis of the results in the US showed that it's the low interest rate/low inflation times when cash/T-bills dominates because reversing of interest rate trends produces a capital loss on the longer term bonds that has minimal to no effect on bills.
This research is why I write that at present cash beats bonds.5 -
The phrase safe withdrawal rate is what is used as the name for academic and other research in this area.mlv-1967 said:There is no such thing as a 'safe' withdrawal rate. If there is one, it would stupidly low, like 1% or maybe 2% at the most. You have to assume that your pot will eventually run out, so with what is left aim to buy an annuity at age 75 when you can receive a reasonable rate, especially if you have a serious illness at that age.
In general it means either what would have worked for the last hundred plus years of historical results or what would work with similar investment results to those in that time period, but randomly sequenced.
The answer tends to be above 3% of starting capital, increasing with uncapped inflation every year for periods up to 40 years, how much above 3% depending on the specific conditions used. How long you should plan for depends in part on life expectancies and at state pension age most can expect to be dead within 30 years.
State pension deferral provides an earlier good way to buy guaranteed extra income, with CPI increases. That and eventual annuity purchasing to cover required spending and maybe a bit more is likely to be a good approach unless leaving an inheritance that is as high as possible is strongly preferred..2 -
Use the Official BOE base rate data. While not accurate in terms of savings rates. You'll obtain an understanding as to how successive UK Governments were able to refinance debt at lower and lower levels of interest. Resulting in existing issues of Treasury and Exchequer stock offering positive returns over many decades. (Other central Banks followed broadly a similar trend). Current status is the potential reversal of nearly 50 years of fiscal policy.OldScientist said:
Interestingly, Pfau (https://retirementresearcher.com/4-rule-work-around-world/ ) says that “In terms of the SAFEMAX, 50% stocks and 50% bills generally outperforms 50% stocks and 50% bonds in the dataset. For bonds, the additional returns over bills failed to compensate for their additional volatility in a retirement income plan …”Prism said:
I would say that is because normally bonds would be expected to do the heavy lifting during equity downturns and they paid a better return at the same time. As it stands cash, including savings accounts offers a better return than bonds and is lower risk. Hence the frequent talk of x number of years in cash as a buffer. Historically a cash buffer was never needed but maybe now cash is better than bonds - at least until QE ends.bostonerimus said:The mathematical models used to derive withdrawal rates can use whatever asset allocation you like, however, I've never seen them include cash. They usually use broad US stock and bond indexes in varying percentages.
Using the annual returns data from the JST Macrohistory dataset (https://www.macrohistory.net) I plotted the SWR obtained over a 30 year retirement period for all starting years using US stocks and bills, i.e. SWR(Bills) as a function of the SWR obtained using stocks and bonds, i.e. SWR(Bonds) (60% stocks in both cases) in the top panel of the following figure. In the bottom panel, the difference between the SWR with bills and the SWR with bonds is plotted as a function of the SWR obtained with bonds
The bottom panel is probably the most illuminating - historically, using bills produced a higher SWR in cases where the SWR was low (below about 4.5%) and a much worse performance when the SWR was high (greater than about 9%). Between these values the performance was mixed.
For the UK, the equivalent graph looked like this
Again, there was a definite trend, but there were cases when the SWR is low, where using bills didn't give any significant advantage over using bonds. For good retirements (SWR higher than 6.5%) bills always underperformed bonds.
I also looked at the other countries in the JST database, but won't bore people with the results except to say that some countries (e.g. Germany, France, Italy, and Japan) generally showed the opposite outcome, i.e. they had a worse performance with bills than with bonds at low SWR.
I also note that I've used bills as a proxy for cash, but as retail investors/savers, we are currently able to get much better interest rates (e.g. in a 1 year fixed rate savings account) than with the more liquid bills. Does anyone know of a database of historical retail interest rates on saving accounts (preferably for the UK)? The archives of MSE only go back so far, while the rate at https://www.bsa.org.uk/BSA/files/5c/5c180498-5e52-4a41-b022-5821c25f3cbd.pdf are patchy before 1950 and (as far as I can tell) only cover retail personal deposits (instant access?).
3


Confirm your email address to Create Threads and Reply

Categories
- All Categories
- 355.1K Banking & Borrowing
- 254.6K Reduce Debt & Boost Income
- 455.8K Spending & Discounts
- 247.8K Work, Benefits & Business
- 604.9K Mortgages, Homes & Bills
- 178.8K Life & Family
- 262.6K Travel & Transport
- 1.5M Hobbies & Leisure
- 16.1K Discuss & Feedback
- 37.7K Read-Only Boards