We’d like to remind Forumites to please avoid political debate on the Forum.
This is to keep it a safe and useful space for MoneySaving discussions. Threads that are – or become – political in nature may be removed in line with the Forum’s rules. Thank you for your understanding.
Debate House Prices
In order to help keep the Forum a useful, safe and friendly place for our users, discussions around non MoneySaving matters are no longer permitted. This includes wider debates about general house prices, the economy and politics. As a result, we have taken the decision to keep this board permanently closed, but it remains viewable for users who may find some useful information in it. Thank you for your understanding.
📨 Have you signed up to the Forum's new Email Digest yet? Get a selection of trending threads sent straight to your inbox daily, weekly or monthly!
The Forum now has a brand new text editor, adding a bunch of handy features to use when creating posts. Read more in our how-to guide
Household Income...
Comments
-
In_For_A_Penny wrote: »I'd be more interested to see the distribution of incomes to see how skewed it is but can't seem to find it on the ONS website.
Here you go.....
Income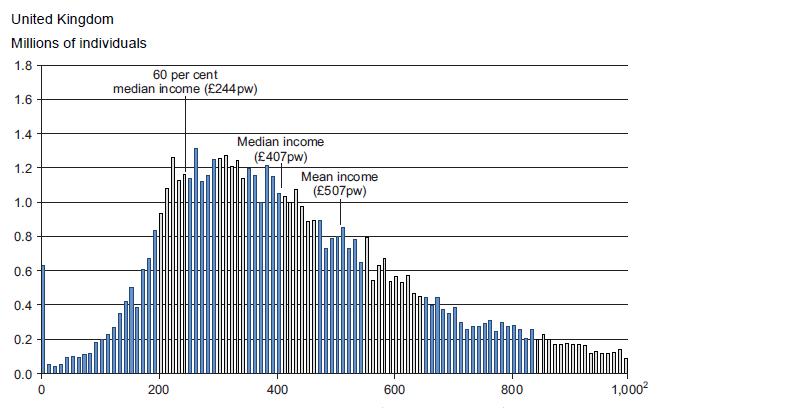
Wealth
House Prices “The great enemy of the truth is very often not the lie – deliberate, contrived, and dishonest – but the myth, persistent, persuasive, and unrealistic.
Belief in myths allows the comfort of opinion without the discomfort of thought.”
-- President John F. Kennedy”0 -
The whole thing is pretty stupid it only takes into account council tax and number of children. Although my income is low especially compared to the results people have posted here I have no mortgage or rent to pay so am obviously better off than someone who does.
That was the one hell of an omission (counting council tax but ignoring rent/mortgage). Maybe they shouldn't have got crashy and bubbles to design the test/identify the main financial criteria.Chuck Norris can kill two stones with one birdThe only time Chuck Norris was wrong was when he thought he had made a mistakeChuck Norris puts the "laughter" in "manslaughter".I've started running again, after several injuries had forced me to stop0 -
And the middle for household income compared to a few decades ago.....
 “The great enemy of the truth is very often not the lie – deliberate, contrived, and dishonest – but the myth, persistent, persuasive, and unrealistic.
Belief in myths allows the comfort of opinion without the discomfort of thought.”
-- President John F. Kennedy”0 -
Hamish thanks for the info, 2 questions:
The weekly income distribution - is that pre or post tax individual or household?
Any idea why the indirect tax take proportion has fallen since 1977 - I would have expected the proportion of income spent on VAT exempt items to have fallen and of course the rate (along with excise duties) has risen. Perhaps we are all spendiong a much higher proportion of incomes on VAT exempt housing due to the shortage of supply resulting in prices being bid up?
The demographic breakdown of the middle fifth may be very interesting but it needs a lot more context on for example population structure to put it into context.I think....0 -
Hamish thanks for the info, 2 questions:
The weekly income distribution - is that pre or post tax individual or household?
Pre-tax individual.
Post tax household looks like this.... Any idea why the indirect tax take proportion has fallen since 1977 -
No, haven't looked into it.The demographic breakdown of the middle fifth may be very interesting but it needs a lot more context on for example population structure to put it into context.
Full data here.....
http://www.ons.gov.uk/ons/dcp171776_303386.pdf“The great enemy of the truth is very often not the lie – deliberate, contrived, and dishonest – but the myth, persistent, persuasive, and unrealistic.
Belief in myths allows the comfort of opinion without the discomfort of thought.”
-- President John F. Kennedy”0 -
Any idea why the indirect tax take proportion has fallen since 1977
I would guess several things:
1. The single market has reduced exercise duty
2. Massive reduction in smoking
3. Gaming duty has been obliterated by the interwebs
4. Most direct taxes (ex-VAT) rise in line with inflation rather than wages. That leaves more money to be spent on non-duty stuff.
5. Huge increase in fuel efficiency0 -
I guessed that 25% are poorer than me... the app decided that 30% are.:www: Progress Report :www:
Offer accepted: £107'000
Deposit: £23'000
Mortgage approved for: £84'000
Exchanged: 2/3/16
:T ... complete on 9/3/16 ... :T0 -
Another big omission is the cost of travelling to work. Commuting from the South Coast into London can cost £4400 a year or more.0
-
HAMISH_MCTAVISH wrote: »
So looking at that chart then. A household with a net income of £3500 per month (£42000 pa) is pretty much in the top 10%.
Yet use the channel 4 how rich are you in the first post, put in two adults and two teenage children and they are firmly in the bottom half. (43% poorer, 57% richer) That same household could be mortgage- free and have no travel to work costs because they stay near their workplace.
In my mind they are pretty well off given these circumstances. It feels to me like they would be in the top 25 - 30% rather than firmly in the bottom half.0 -
PasturesNew wrote: »I am richer than 1%.
Well don't shout about it. They'll all be round asking to borrow a fiver.0


This discussion has been closed.
Confirm your email address to Create Threads and Reply

Categories
- All Categories
- 354.4K Banking & Borrowing
- 254.4K Reduce Debt & Boost Income
- 455.4K Spending & Discounts
- 247.3K Work, Benefits & Business
- 604K Mortgages, Homes & Bills
- 178.4K Life & Family
- 261.5K Travel & Transport
- 1.5M Hobbies & Leisure
- 16K Discuss & Feedback
- 37.7K Read-Only Boards