We’d like to remind Forumites to please avoid political debate on the Forum.
This is to keep it a safe and useful space for MoneySaving discussions. Threads that are – or become – political in nature may be removed in line with the Forum’s rules. Thank you for your understanding.
📨 Have you signed up to the Forum's new Email Digest yet? Get a selection of trending threads sent straight to your inbox daily, weekly or monthly!
The Forum now has a brand new text editor, adding a bunch of handy features to use when creating posts. Read more in our how-to guide
Really need help understanding pension statements

village_life
Posts: 336 Forumite
Hi
please can someone help. My pension statements are driving me insane. I've just had this years through and it states:
"The rate of growth used in this illustration is calculated as an average return from the fund(s) invested in, using the proportion of each fund held. This rate is based on our view of potential long-term returns of the main asset classes (equities, property, corporate bonds, government bonds and cash) and will vary depending on the fund(s). This rate is not guaranteed
The rate we've used for projecting your existing fund holding is 2.92%
The rate we've used for projecting your future expected contributions is 3.17%"
Compare this to last year where it said
The rate we've used for projecting your existing fund holding is 5.5%
The rate we've used for projecting your future expected contributions is 5.5%"
Critically, in the past year I HAVE changed my investments to alternative funds, as originally I was in the default "Lifestyle" fund. I did check the comparative performance charts though, and the ones I selected consistently outperform the default. I've checked again and here is the performance chart
[IMG][/img]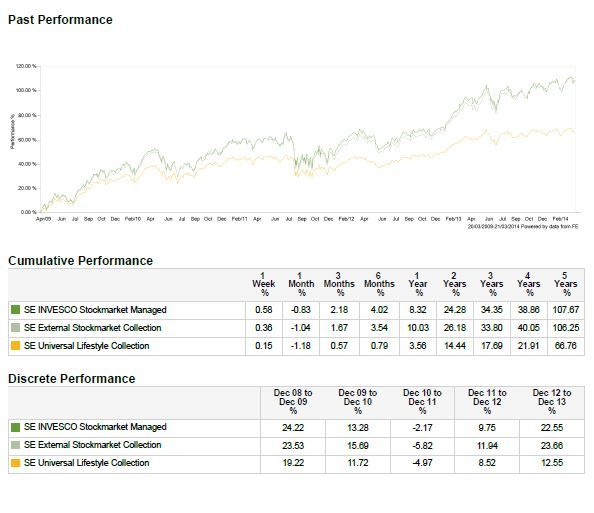
http://i1261.photobucket.com/albums/ii589/RoberteQuagmire/Capture_zps3975fefc.png
I am really at a loss to understand why the projection has been downscaled with this in mind? Should I revert back to default funds? I am spending a lot of time on pensions and dont seem to be getting anywhere
would appreciate any help offered
please can someone help. My pension statements are driving me insane. I've just had this years through and it states:
"The rate of growth used in this illustration is calculated as an average return from the fund(s) invested in, using the proportion of each fund held. This rate is based on our view of potential long-term returns of the main asset classes (equities, property, corporate bonds, government bonds and cash) and will vary depending on the fund(s). This rate is not guaranteed
The rate we've used for projecting your existing fund holding is 2.92%
The rate we've used for projecting your future expected contributions is 3.17%"
Compare this to last year where it said
The rate we've used for projecting your existing fund holding is 5.5%
The rate we've used for projecting your future expected contributions is 5.5%"
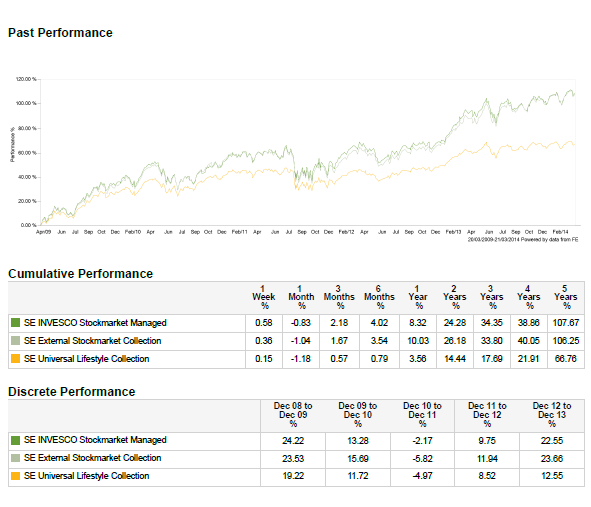
Critically, in the past year I HAVE changed my investments to alternative funds, as originally I was in the default "Lifestyle" fund. I did check the comparative performance charts though, and the ones I selected consistently outperform the default. I've checked again and here is the performance chart
[IMG][/img]

http://i1261.photobucket.com/albums/ii589/RoberteQuagmire/Capture_zps3975fefc.png
I am really at a loss to understand why the projection has been downscaled with this in mind? Should I revert back to default funds? I am spending a lot of time on pensions and dont seem to be getting anywhere
would appreciate any help offered
0
Comments
-
The illustrative calculations are based on government specified parameters. These change frequently and so it is not too meaningful to compare one year's illustration with another year's.
One change that seems to have happened recently is that the FCA have required illustrations to be inflation adjusted. That would certainly fit the difference in figures you have seen.0 -
Thanks Linton
I try to not pay too much attention to the comparisons of the statements as I've seen these change previously, I was just concerned that following my investment decision changes that I'd screwed up my decision or that I should have looked deeper than the comparative performance of the funds?
My wife is in same scheme and I am doing similar with her funds, hence the importance of getting it right - can I continue to presume that while my fund is growing (per the charts) that all is well (I do monitor this routinely)0 -
Yes, though perhaps safer to base your assessment on the actual changes in pot size which will be in your annual statement. Monitor these against your retirement plan (you do have one?) which would tell you the pot size you need. The amount of contribution is more significant than choosing one fund rather than another in much the same sectors.
Monitoring performance too frequently is pretty meaningless and potentially dangerous if it leads you to change investments too often.0 -
Hi
I don't really have a "retirement plan" as such albeit I do monitor my pensions annually and based on the online calculators I have a good idea where it's projected to end up and am relatively comfortable.
In terms of your advice would you propose just to take a view annually on the % growth achieved each year and track against that? I've often struggled to understand how best to track and evaluate this, although it's often on my mind0 -
The most likely explanation is that last year's growth rate of 5.5% was a nominal rate whereas this year's rate is the projected yield after the estimated effect of inflation.
Although the projected numbers look lower, the advantage is that the spending power of the projected income is directly comparable to your income today so that you don't have to mentally account for prices going up between now and retirement.0


This discussion has been closed.
Confirm your email address to Create Threads and Reply

Categories
- All Categories
- 353.5K Banking & Borrowing
- 254.2K Reduce Debt & Boost Income
- 455K Spending & Discounts
- 246.6K Work, Benefits & Business
- 602.9K Mortgages, Homes & Bills
- 178.1K Life & Family
- 260.6K Travel & Transport
- 1.5M Hobbies & Leisure
- 16K Discuss & Feedback
- 37.7K Read-Only Boards