We’d like to remind Forumites to please avoid political debate on the Forum.
This is to keep it a safe and useful space for MoneySaving discussions. Threads that are – or become – political in nature may be removed in line with the Forum’s rules. Thank you for your understanding.
Debate House Prices
In order to help keep the Forum a useful, safe and friendly place for our users, discussions around non MoneySaving matters are no longer permitted. This includes wider debates about general house prices, the economy and politics. As a result, we have taken the decision to keep this board permanently closed, but it remains viewable for users who may find some useful information in it. Thank you for your understanding.
📨 Have you signed up to the Forum's new Email Digest yet? Get a selection of trending threads sent straight to your inbox daily, weekly or monthly!
BOE - Mortgage Lending data weaker than expected
Comments
-
Graham_Devon wrote: »Gotta admit, the news is going exactly the way of the last downturn, which ad posted up the other day.
Up one month, down the next 2 months, then up and its a recovery, then back down.
My thoughts? We need to stop micro reporting and releasing new presdictions for the economy month on month. When theres a rise, predictions change, when there a fall the next month, predictions change again.
Plus, it's causing a lot of arguments on here!
I think the most usefully piece of data on here would be to see what the volumes were when they stabilized in the 80s/90s.0 -
Graham_Devon wrote: »Gotta admit, the news is going exactly the way of the last downturn, which ad posted up the other day.
Up one month, down the next 2 months, then up and its a recovery, then back down.
My thoughts? We need to stop micro reporting and releasing new presdictions for the economy month on month. When theres a rise, predictions change, when there a fall the next month, predictions change again.
Plus, it's causing a lot of arguments on here!
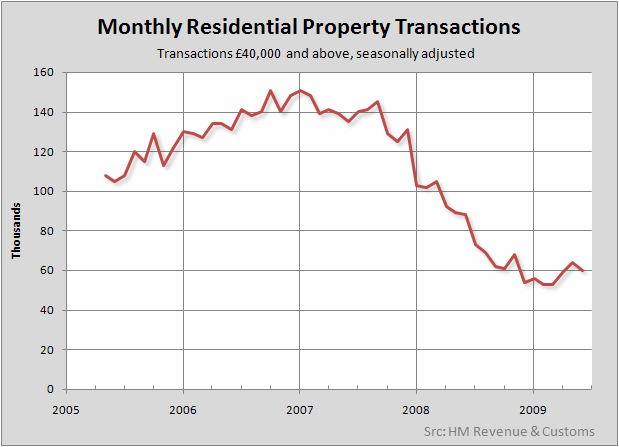
totally agree - looking at these of one month is useless. we still have low volumes.
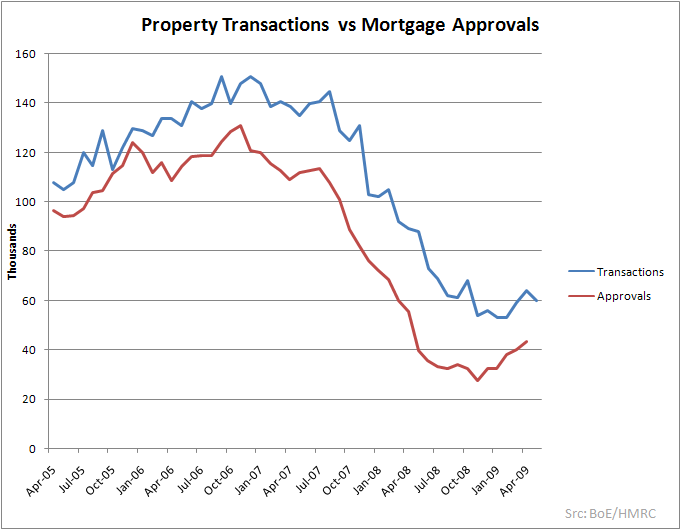
have a look at my graph below to give it a bit more context - mortgage approvals vs house sale transactions. property transactions going down but mortgage approvals going upad44downey wrote: »This graph clearly exposes all this talk of green shoots for the nonsense it is. The crash is back on.
your graph against mortgage approvals looks very different and probably not what you wanted to prove... :wave: 0
0 -
Mortgage approvals don't need to go down because transactions are going down to prove anything.
Infact, I would suggest that transactions are going down, because people are being told straight away, they aint gonna get a mortgage.0 -
Graham_Devon wrote: »Mortgage approvals don't need to go down because transactions are going down to prove anything.
Infact, I would suggest that transactions are going down, because people are being told straight away, they aint gonna get a mortgage.
looking at the 'picture' historically there was correlation but not in the past few months.
good delete btw
agreeing with your original post was the fact that looking at just one months figures in a non-normal QE climate is not going to tell you anything whatsoever.0 -
-
blunt_crayon wrote: »over 5 years of relative stability Jan 95-Jan 00 transactions seemed to average 80-90k a month.
I would say in the last crash 92-95 was stable in terms of price.
From 95-2000 prices increased 43% in real terms.
have you got any data for 92-95?0 -
no the land registry only starts in 1995. i just looked at the earliest figures available and prices didn't look to increase massively over the long term.
[IMG]http://www1.landregistry.gov.uk/houseprices/housepriceindex/report/default.asp?g=1&gt=2&a=E&W-ALL&s=01 January 1995&e=01 January 2000&t=1[/IMG]plus ça change........0 -
blunt_crayon wrote: »no the land registry only starts in 1995. i just looked at the earliest figures available and prices didn't look to increase massively over the long term.
Cheers I looked at old faithfully (the nationwide graph on HPC)
That seems to say in real terms house prices went from £70K - £100K in that period.
It would be interesting to see what the figures were like when prices stagnated in the last crash. (purely as some kind of indicator)
Nominal stagnation looks to be 1992-1995. 0
0 -
-
totally agree - looking at these of one month is useless. we still have low volumes.
have a look at my graph below to give it a bit more context - mortgage approvals vs house sale transactions. property transactions going down but mortgage approvals going up
your graph against mortgage approvals looks very different and probably not what you wanted to prove... :wave:
Could be an indication of people applying for or booking fixed rates even though they haven't found a house to purchase.0
This discussion has been closed.
Confirm your email address to Create Threads and Reply

Categories
- All Categories
- 352.1K Banking & Borrowing
- 253.5K Reduce Debt & Boost Income
- 454.2K Spending & Discounts
- 245.1K Work, Benefits & Business
- 600.7K Mortgages, Homes & Bills
- 177.4K Life & Family
- 258.9K Travel & Transport
- 1.5M Hobbies & Leisure
- 16.2K Discuss & Feedback
- 37.6K Read-Only Boards

